A tour of the Console
The Console is at /console on every QueryAPIGate server - nothing separate to install. Each screen below, with what
it's for; click one for the full size. The README has the
SQL editor, the demo video and the architecture.
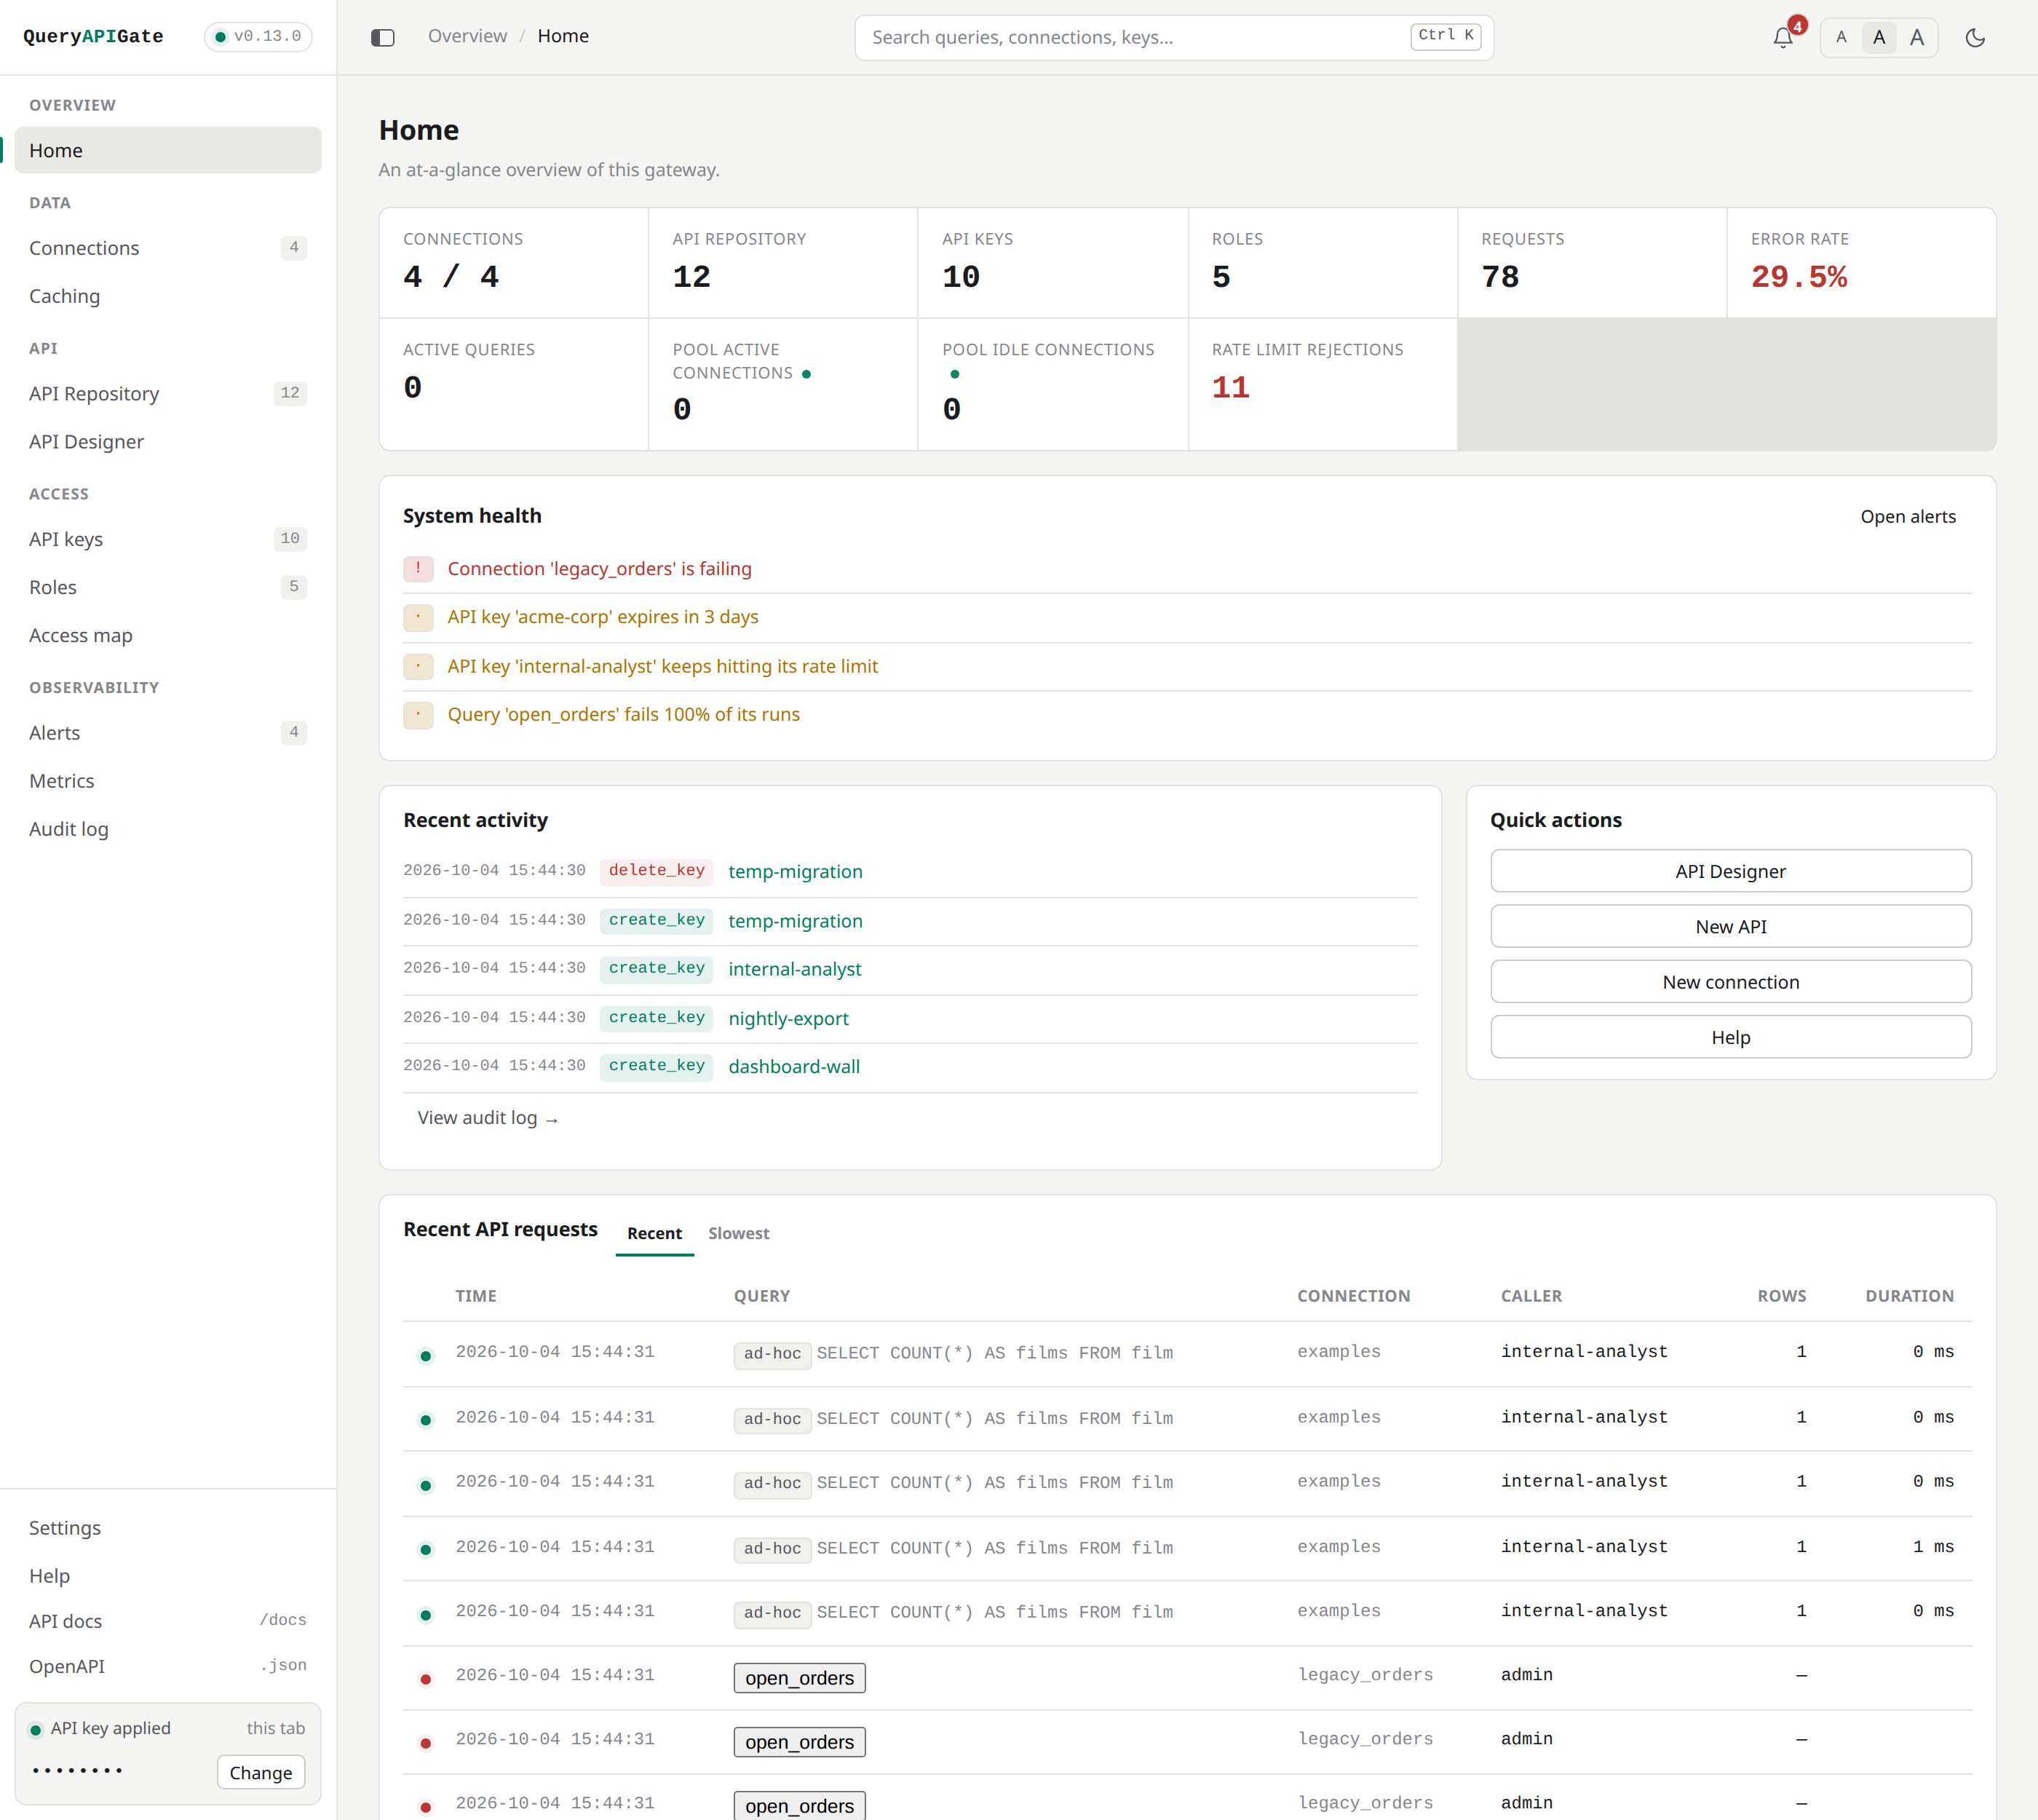
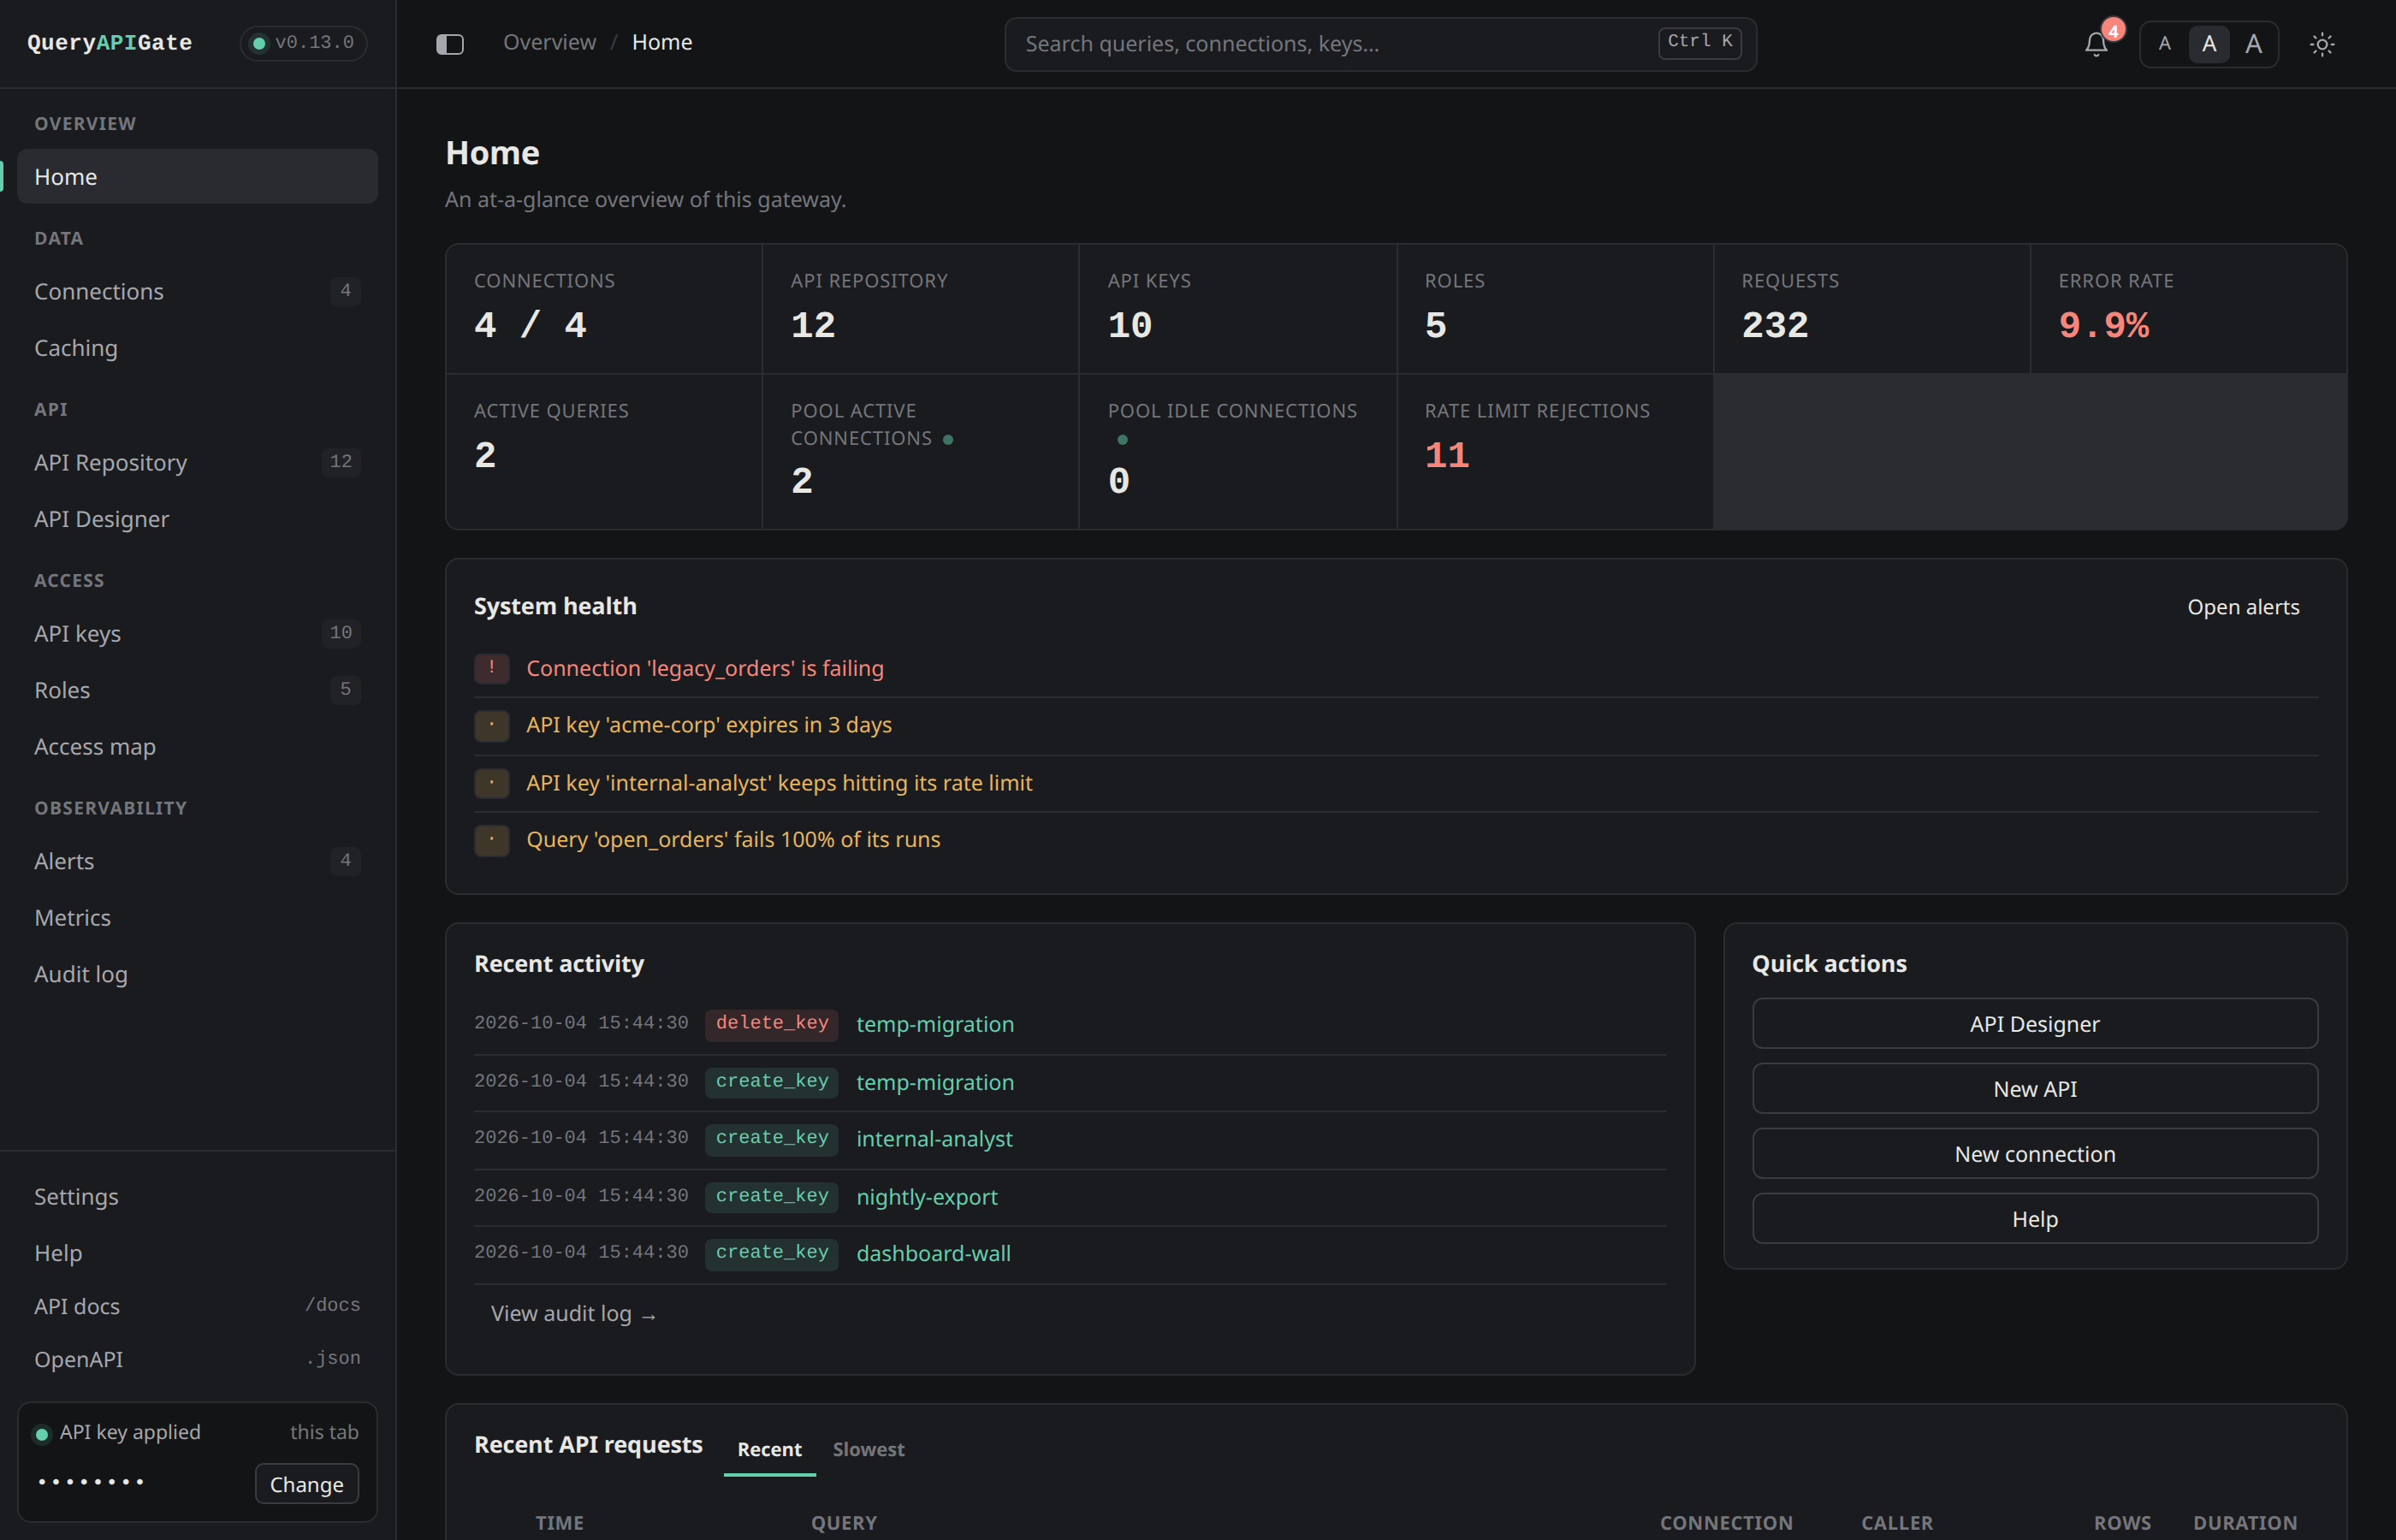
Home: live totals, what needs attention, recent activity, and every recent request - saved APIs and ad-hoc SQL alike.
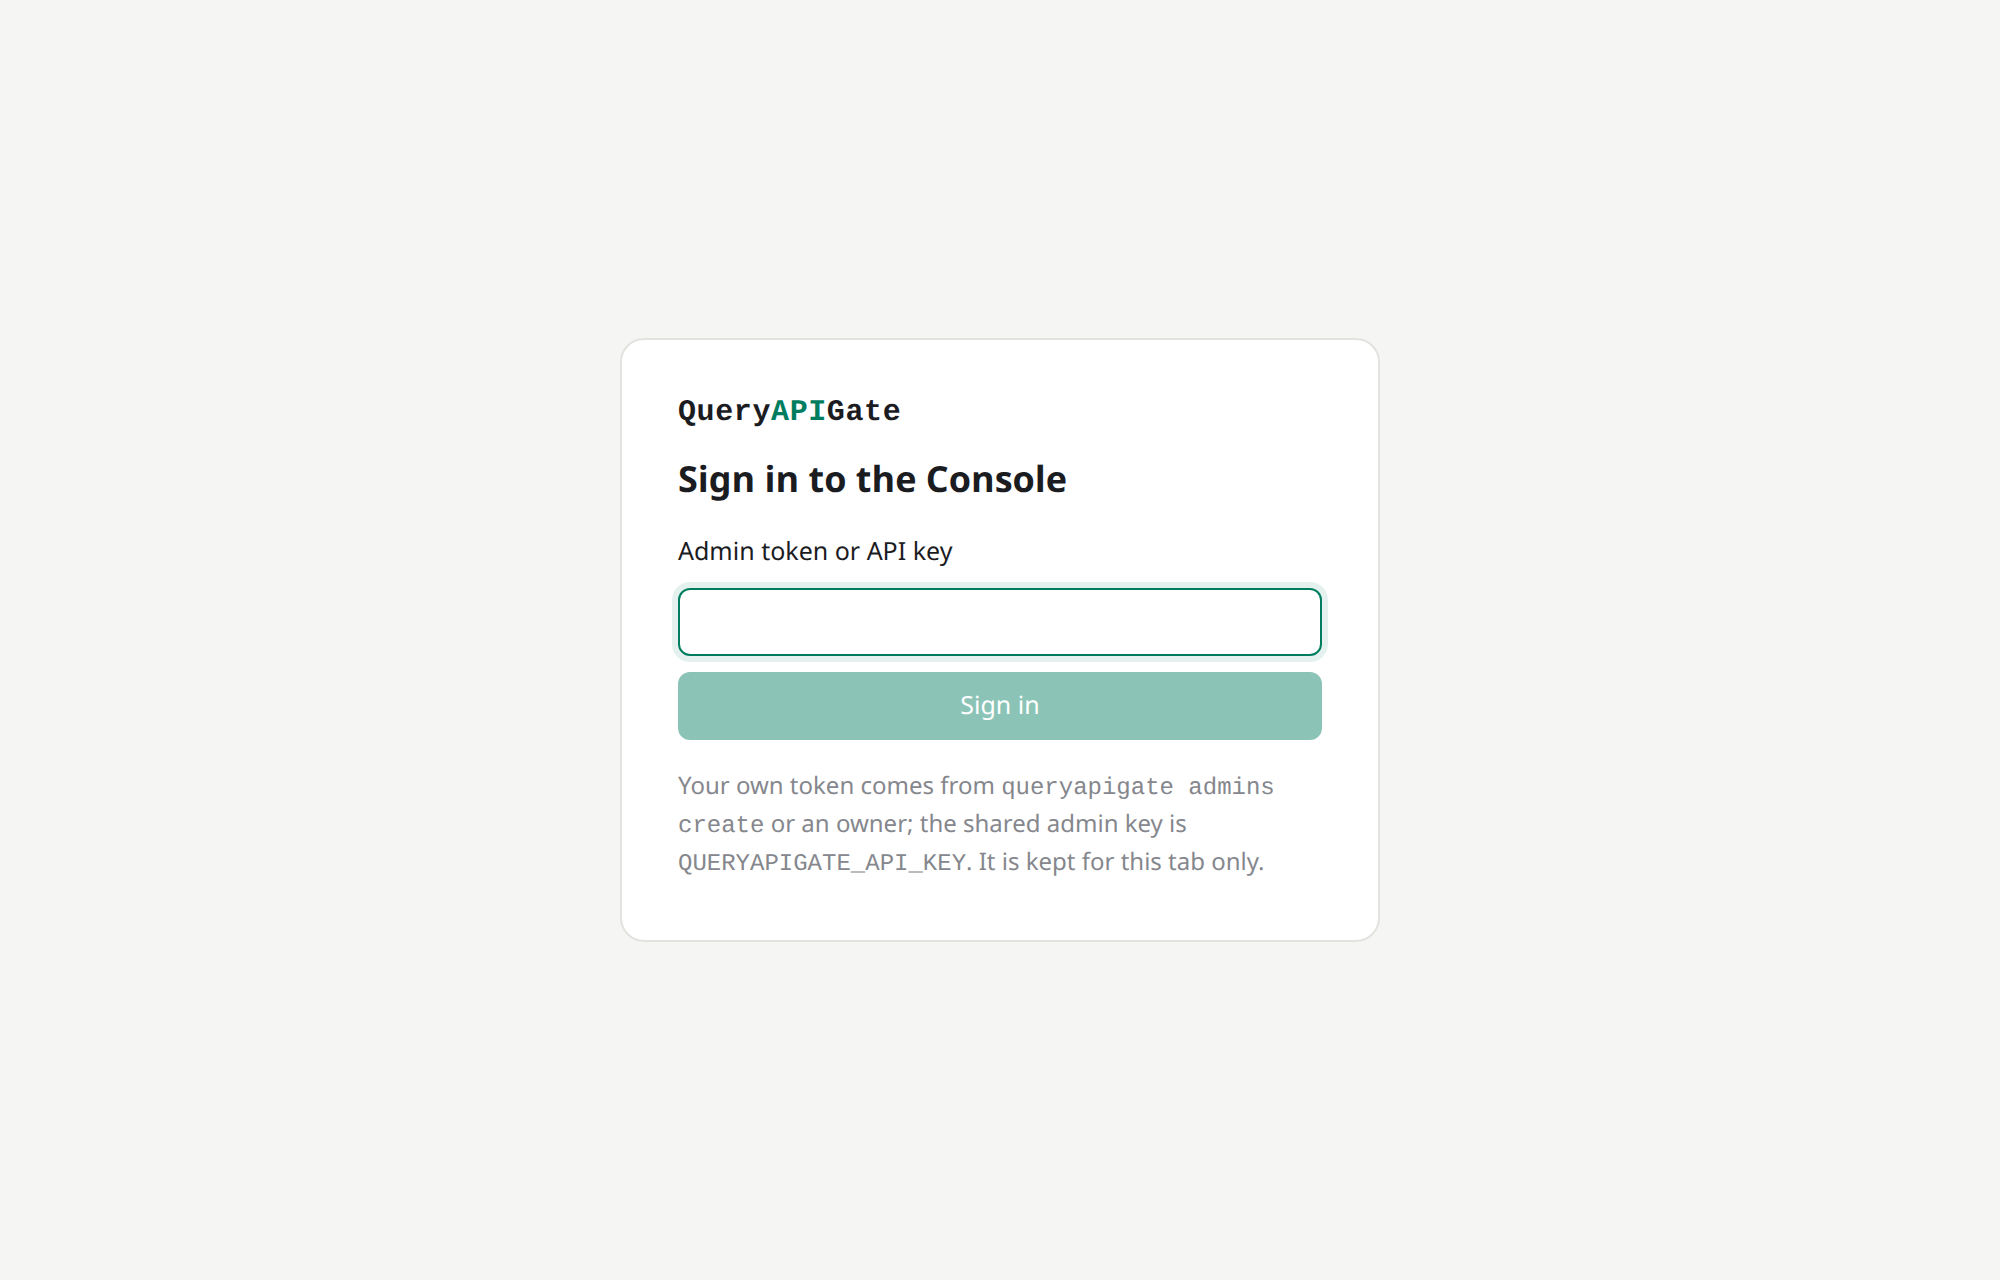
Signed out, a tab sees only the sign-in page - Sign in with SSO when it's set up, or an admin token |
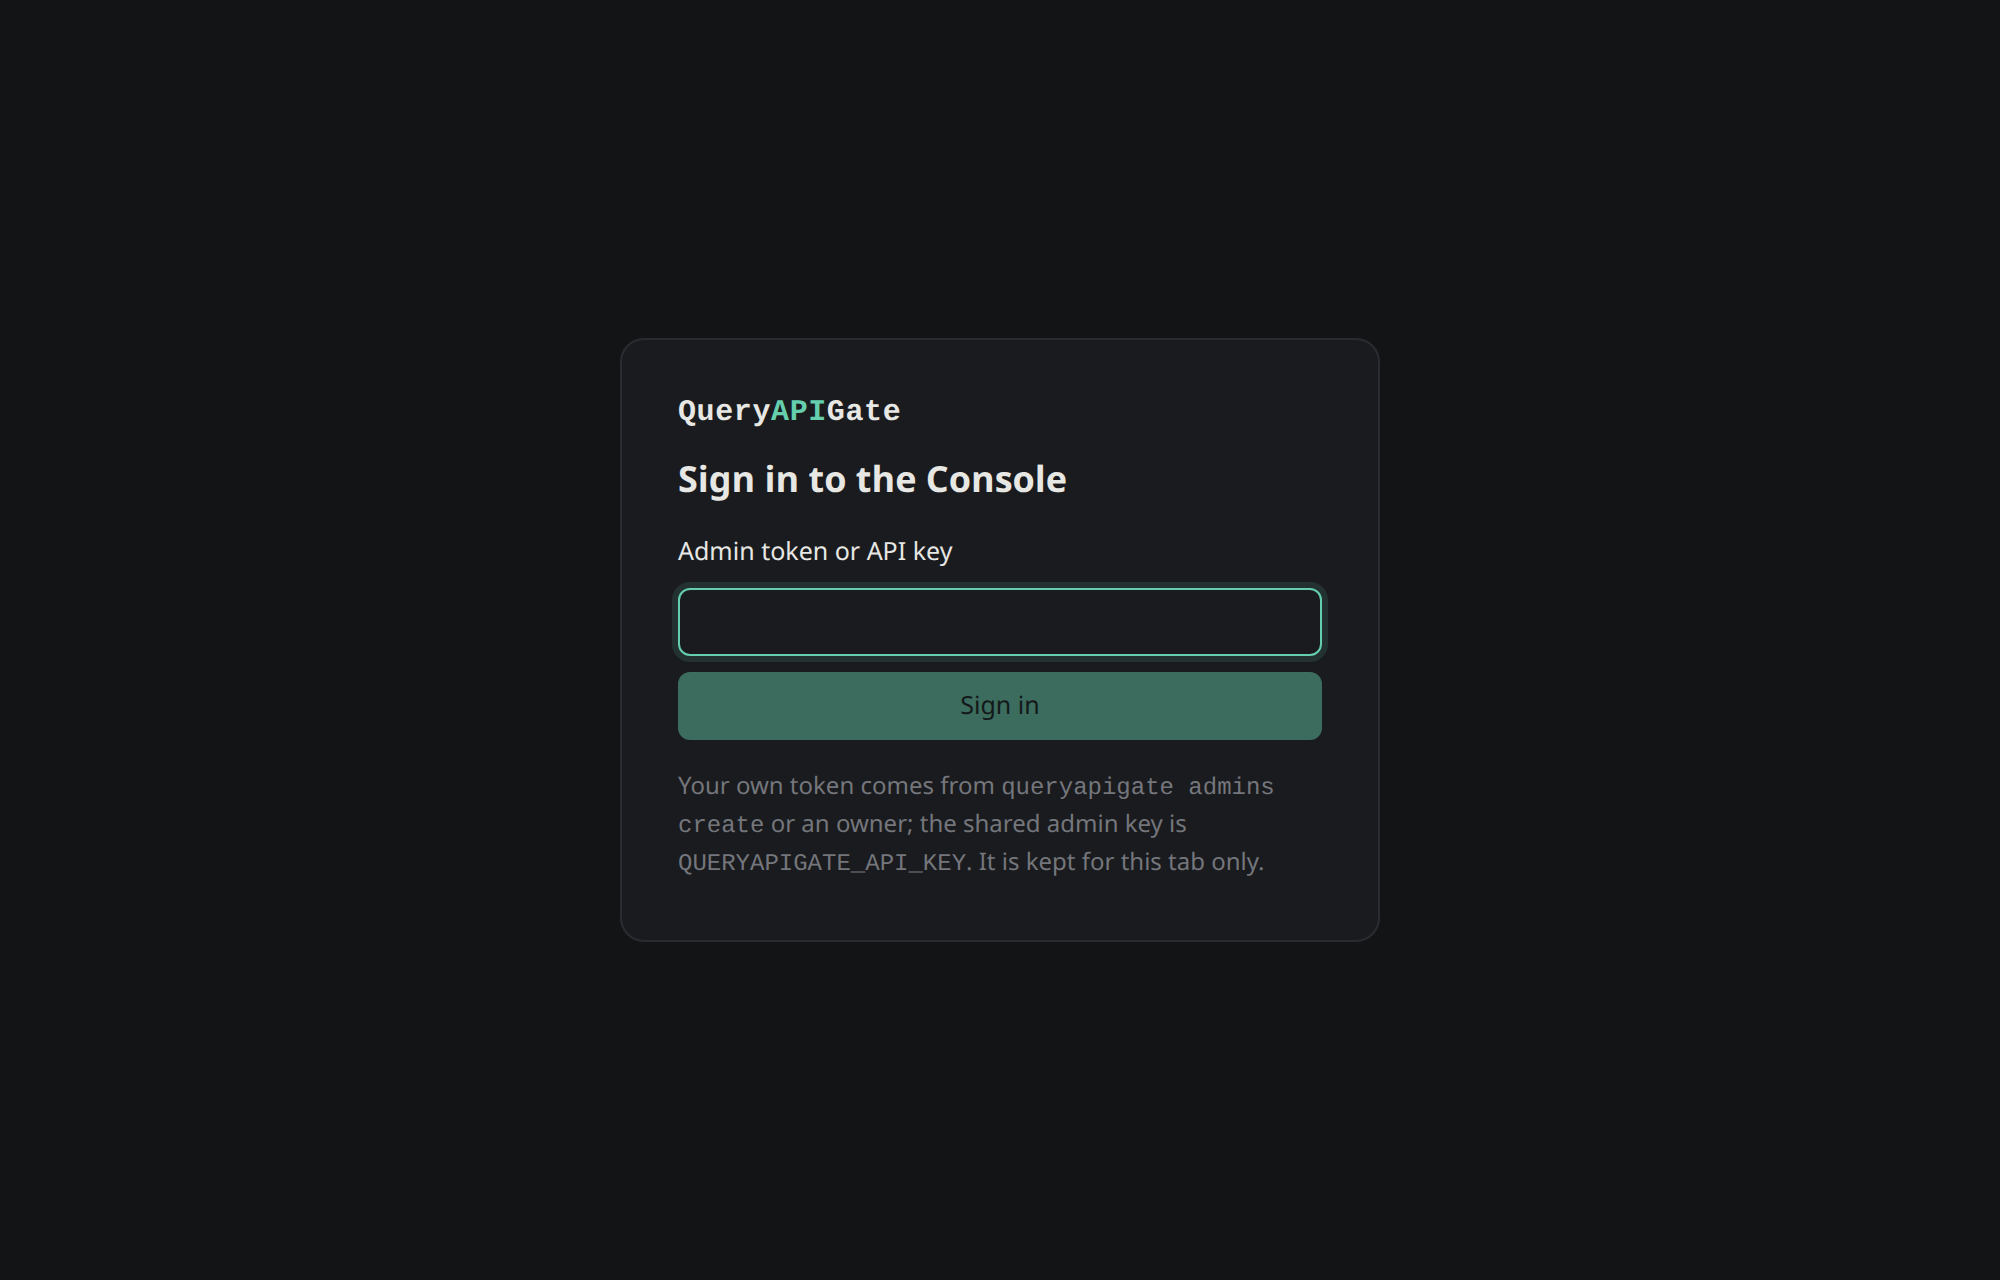
The same page in the dark theme, following the operating system's |
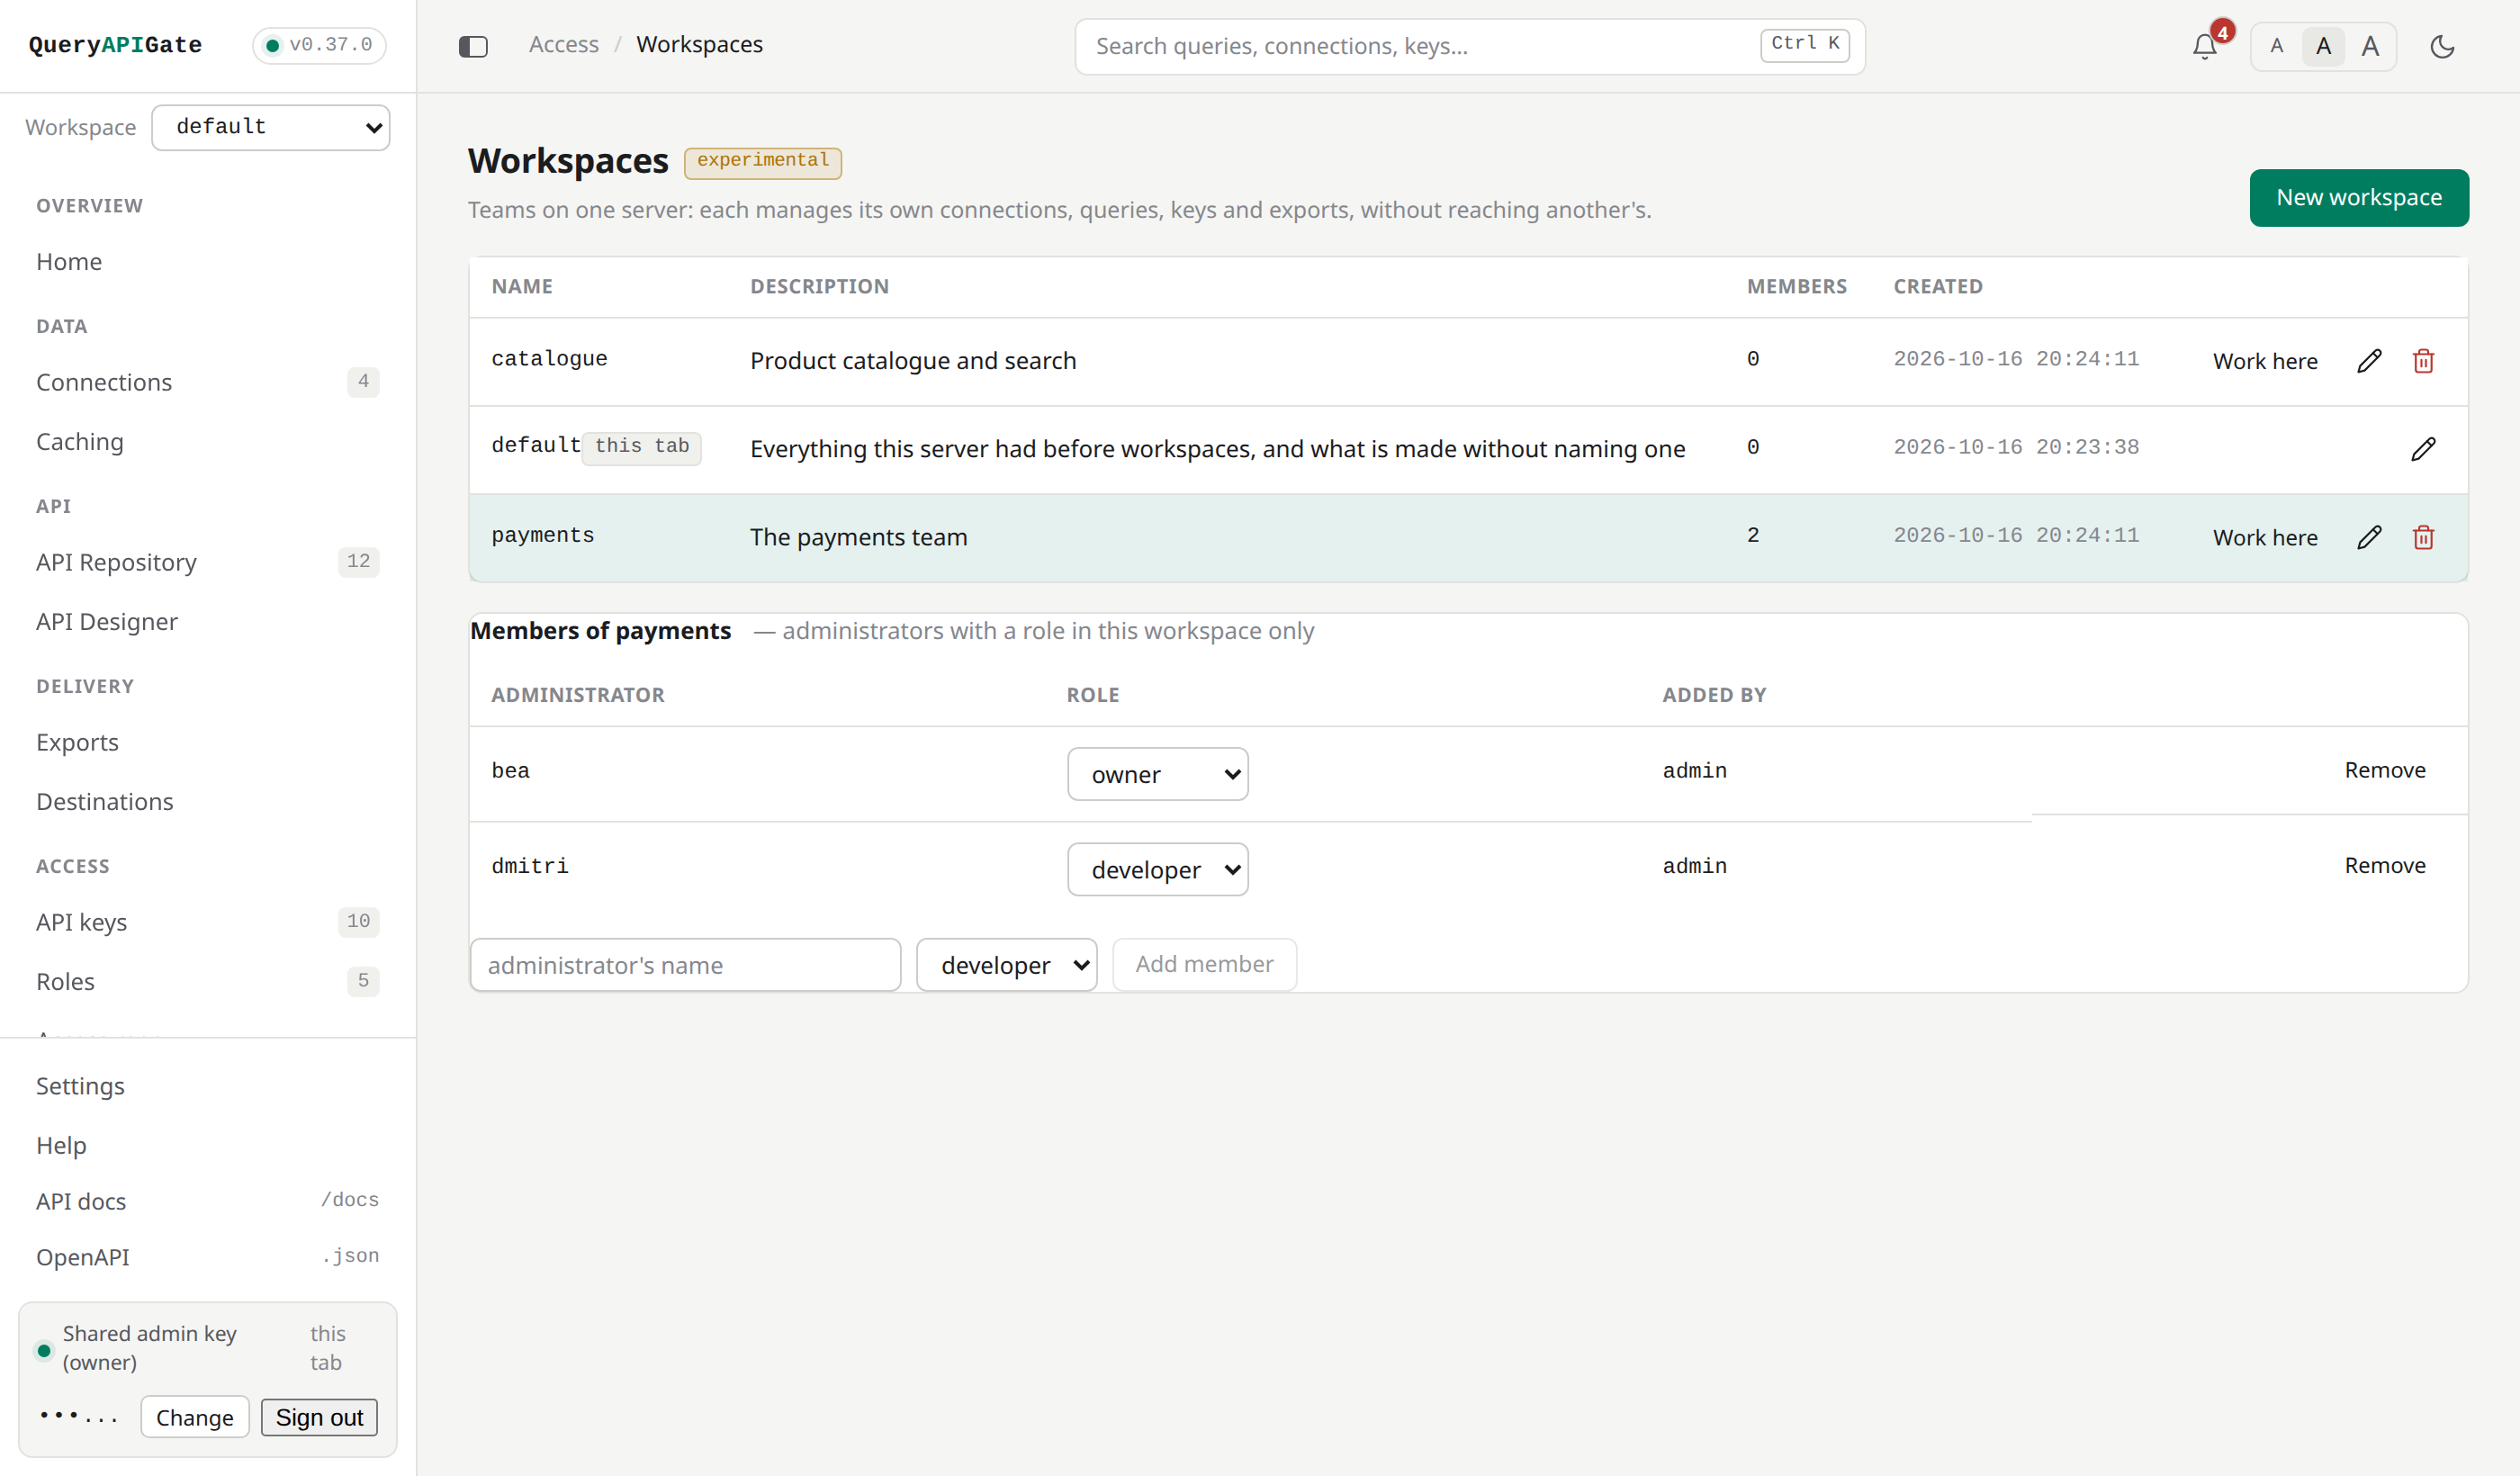
Workspaces (experimental): teams on one server, each running its own connections, queries and keys - with the switcher under the wordmark, and each workspace's members.
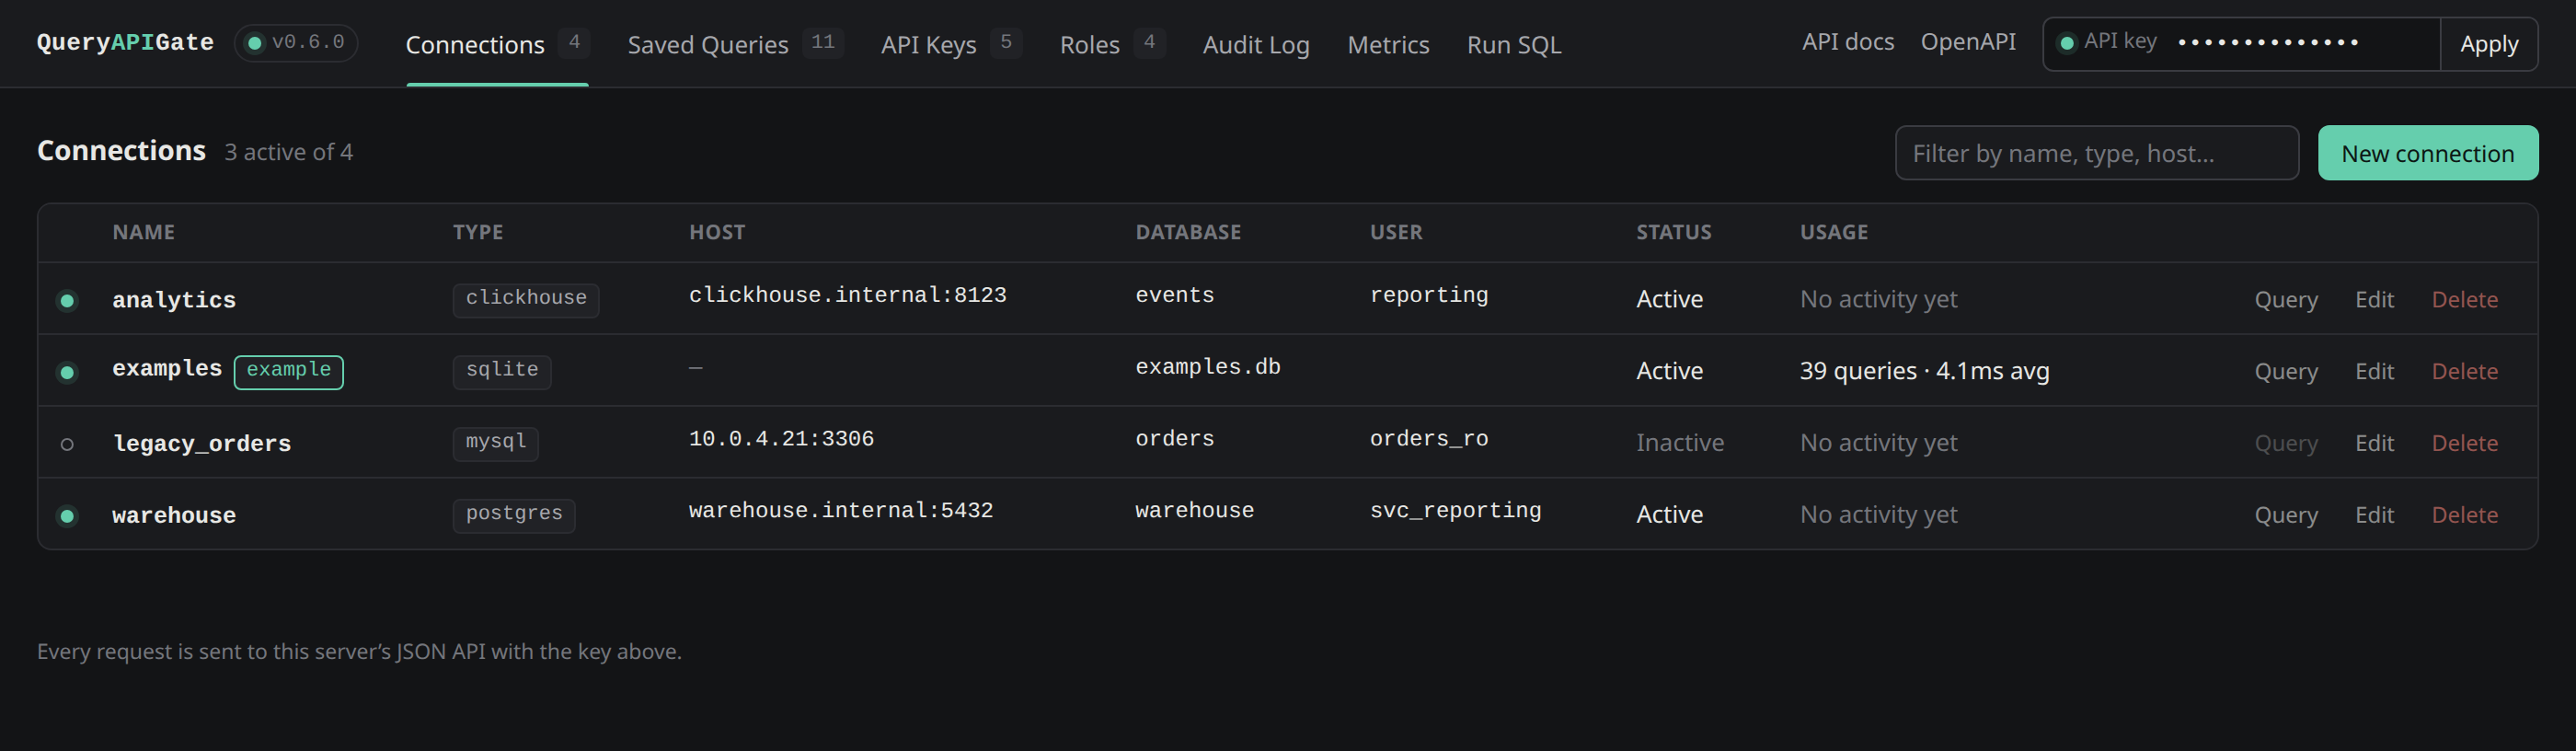
Manage connections across every supported database, with live usage per connection |
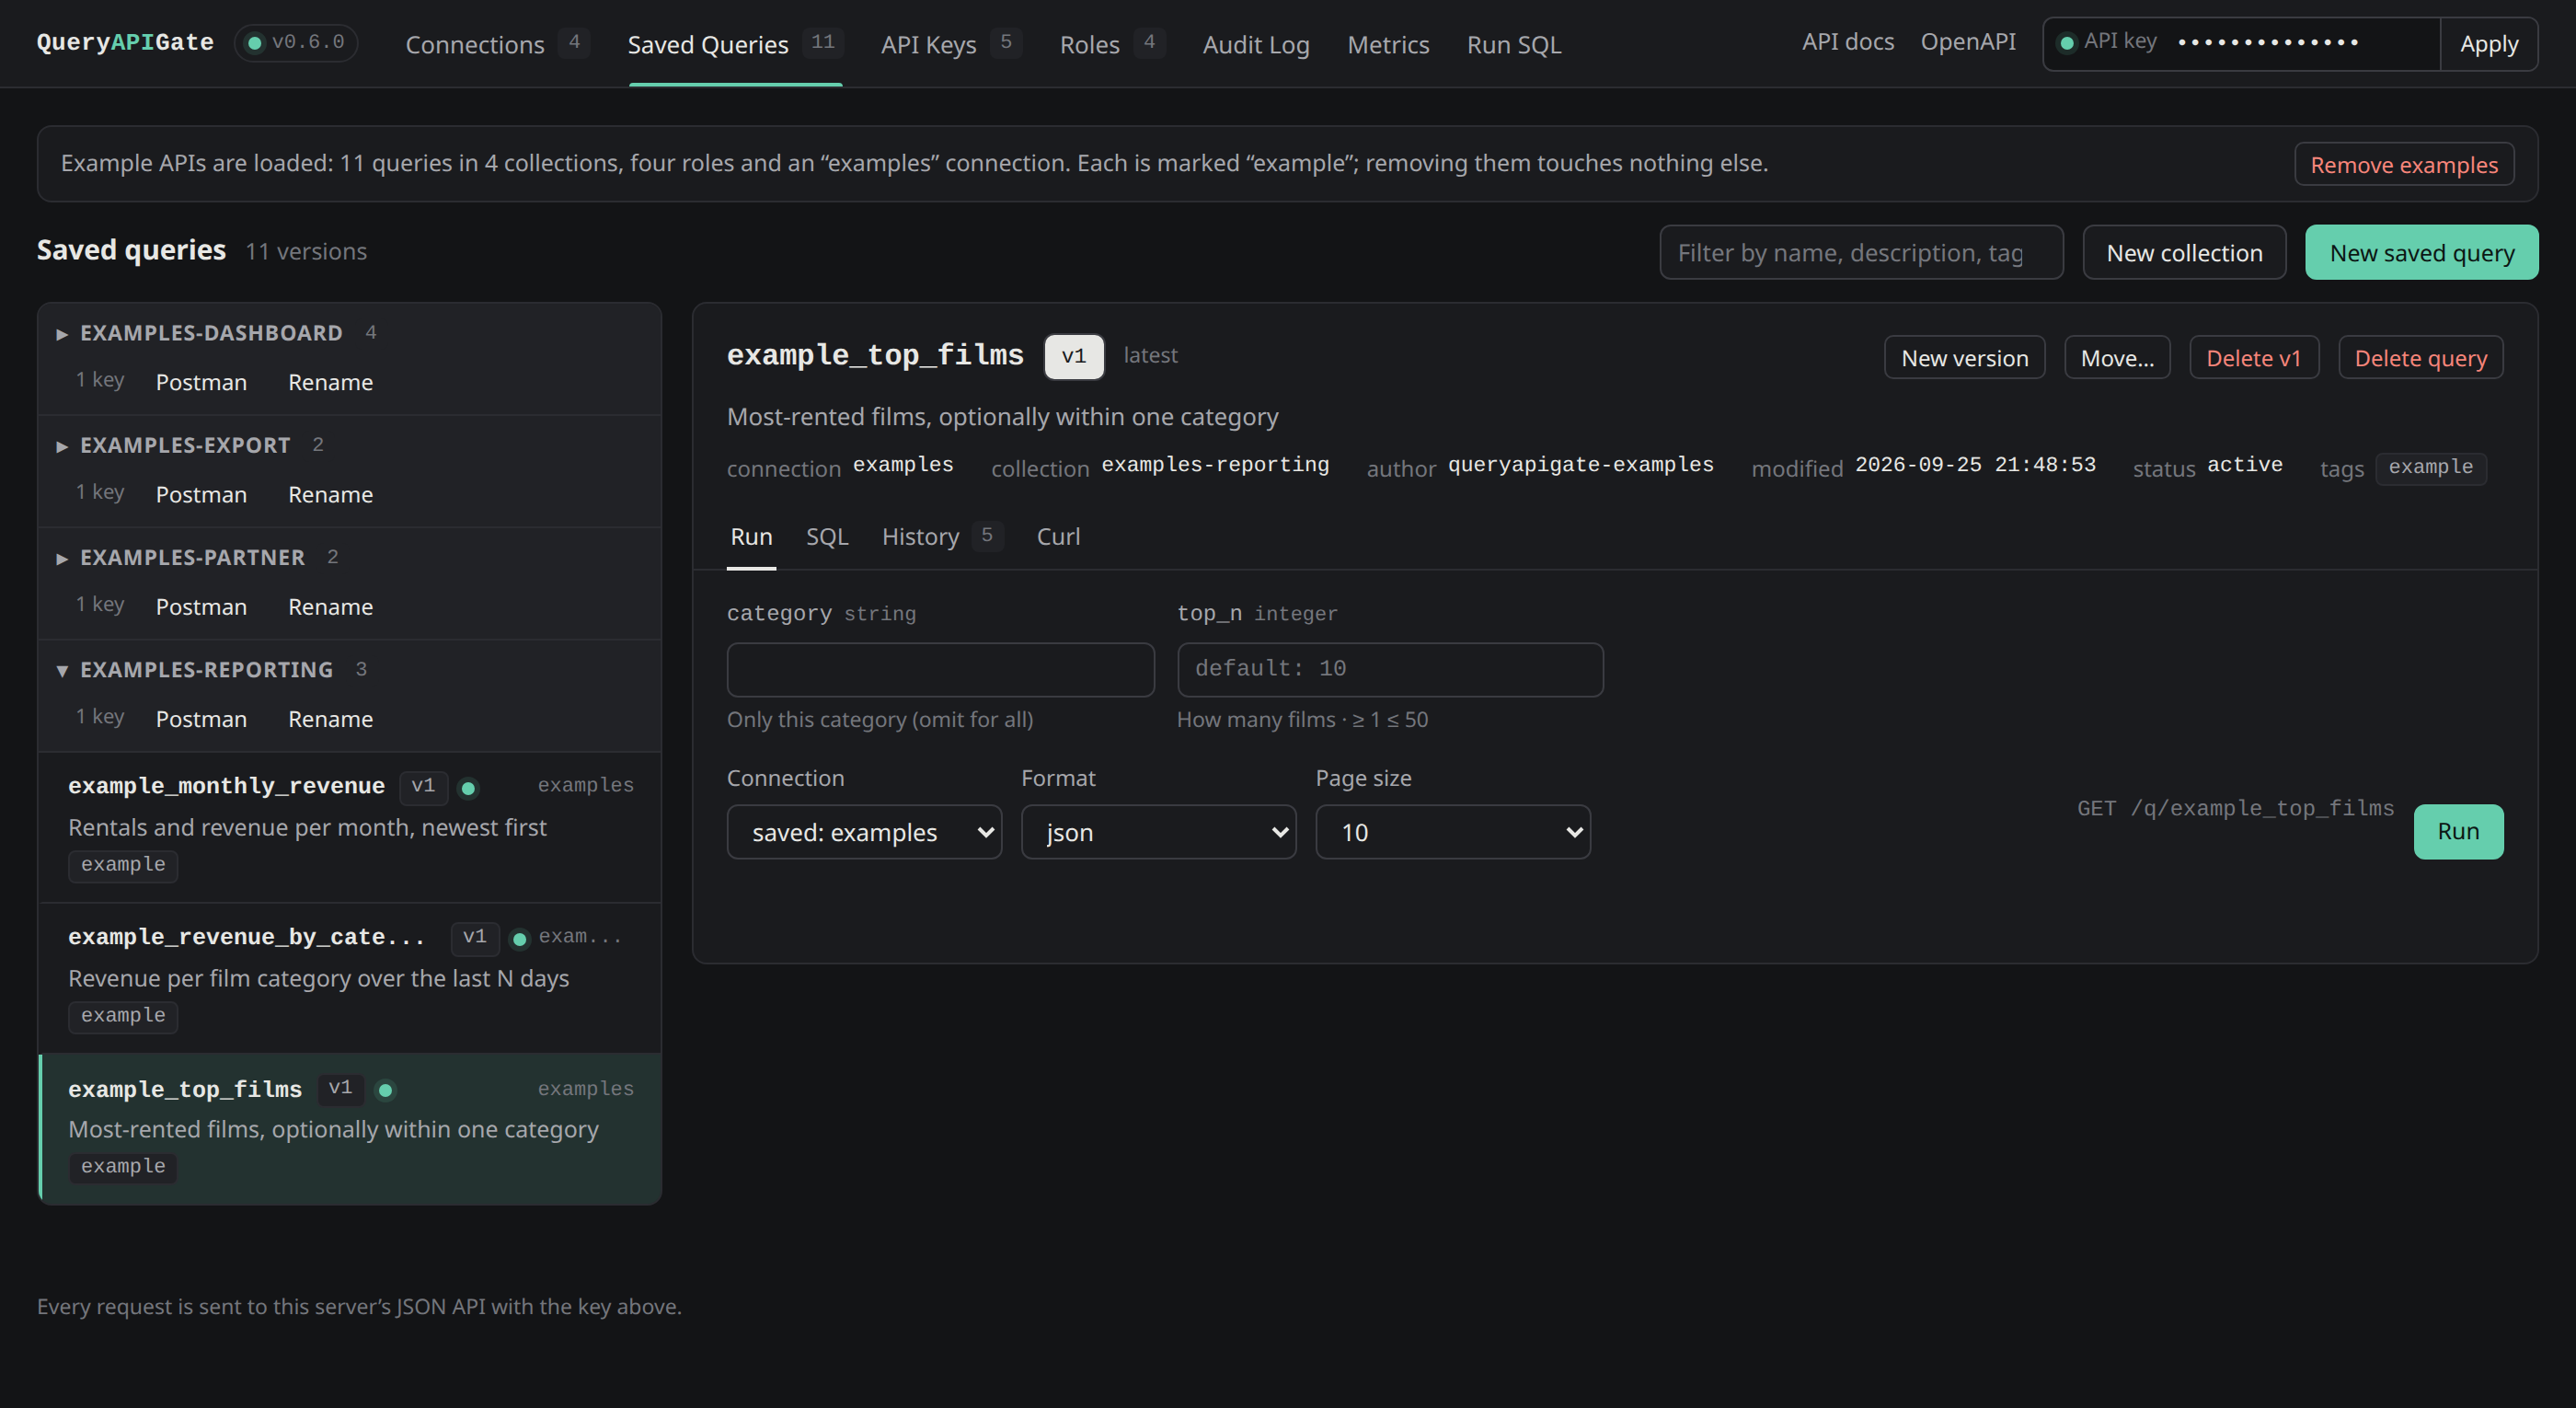
Every saved query becomes a documented REST endpoint - grouped into collections |
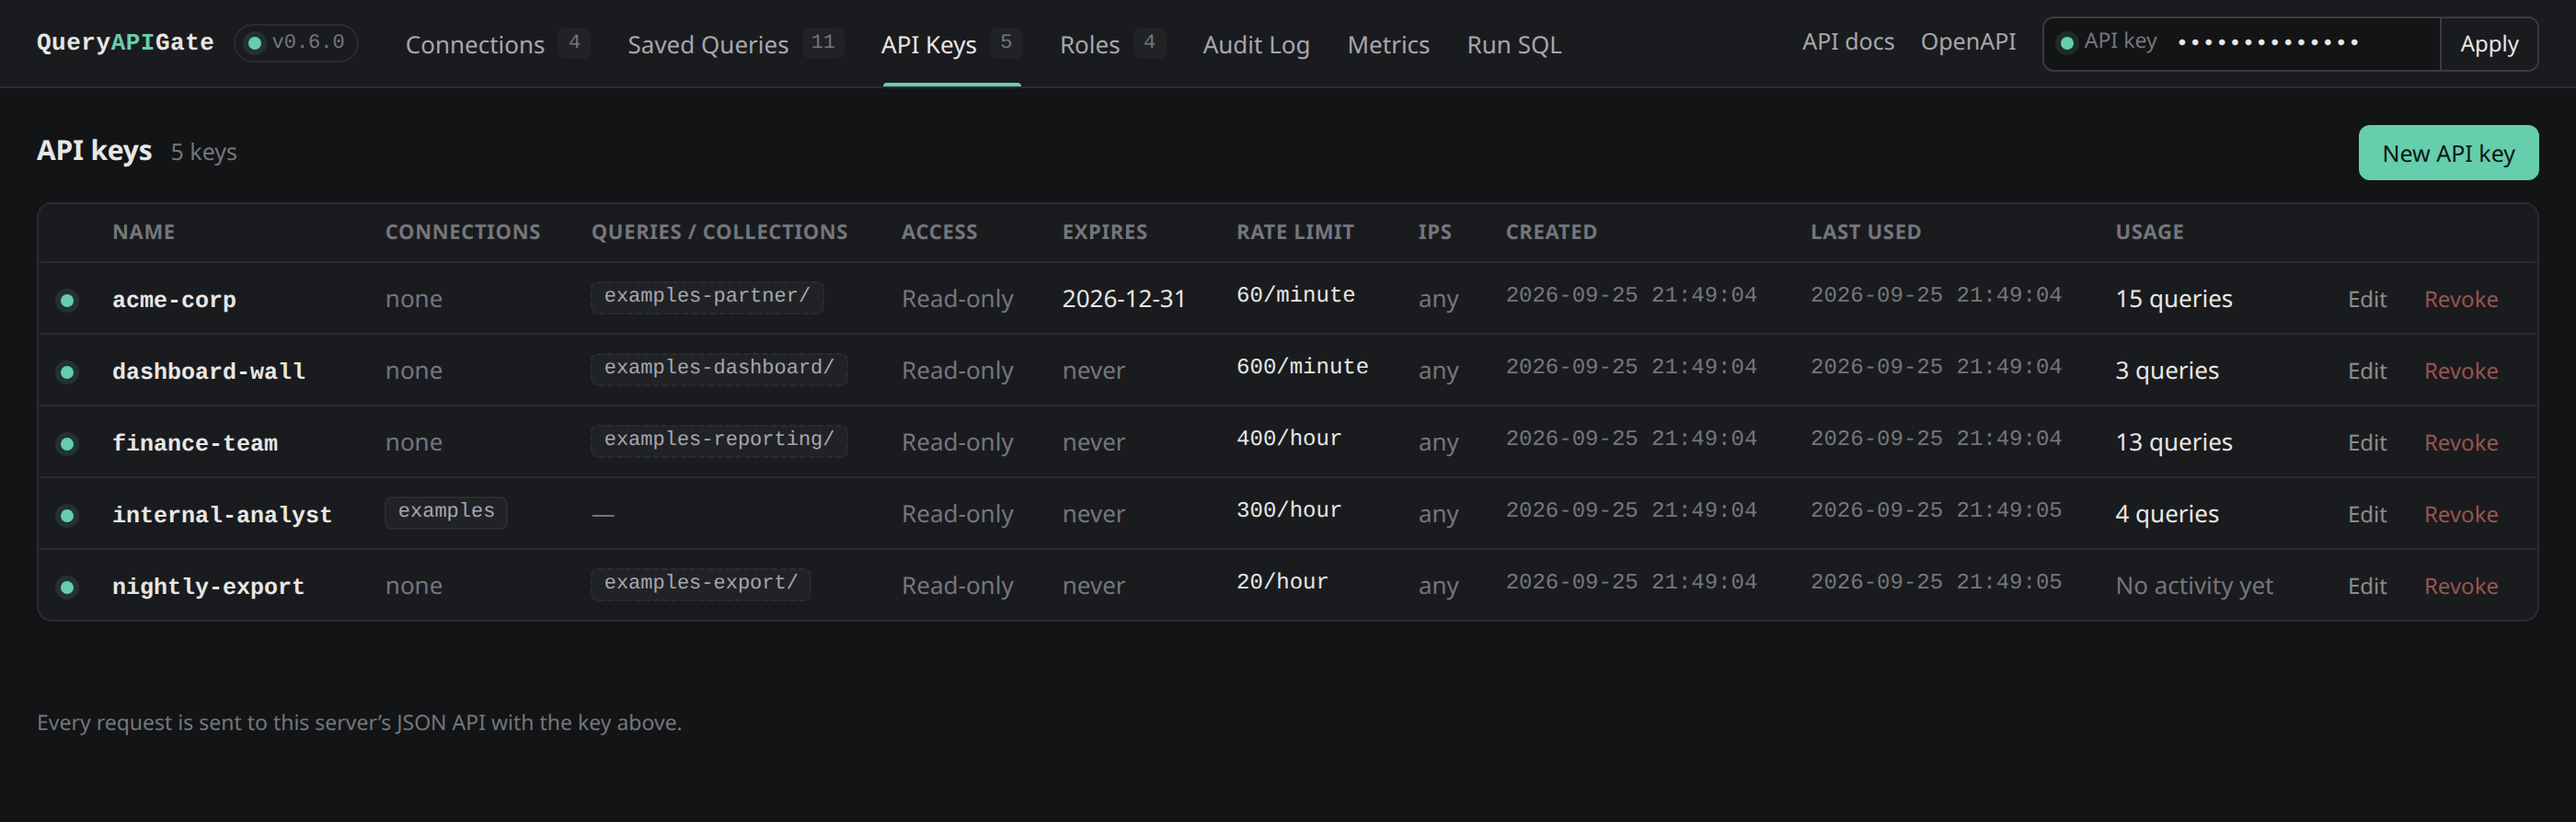
Per-key permissions: connections, specific saved queries, expiry, rate limits - and what each key has actually done |
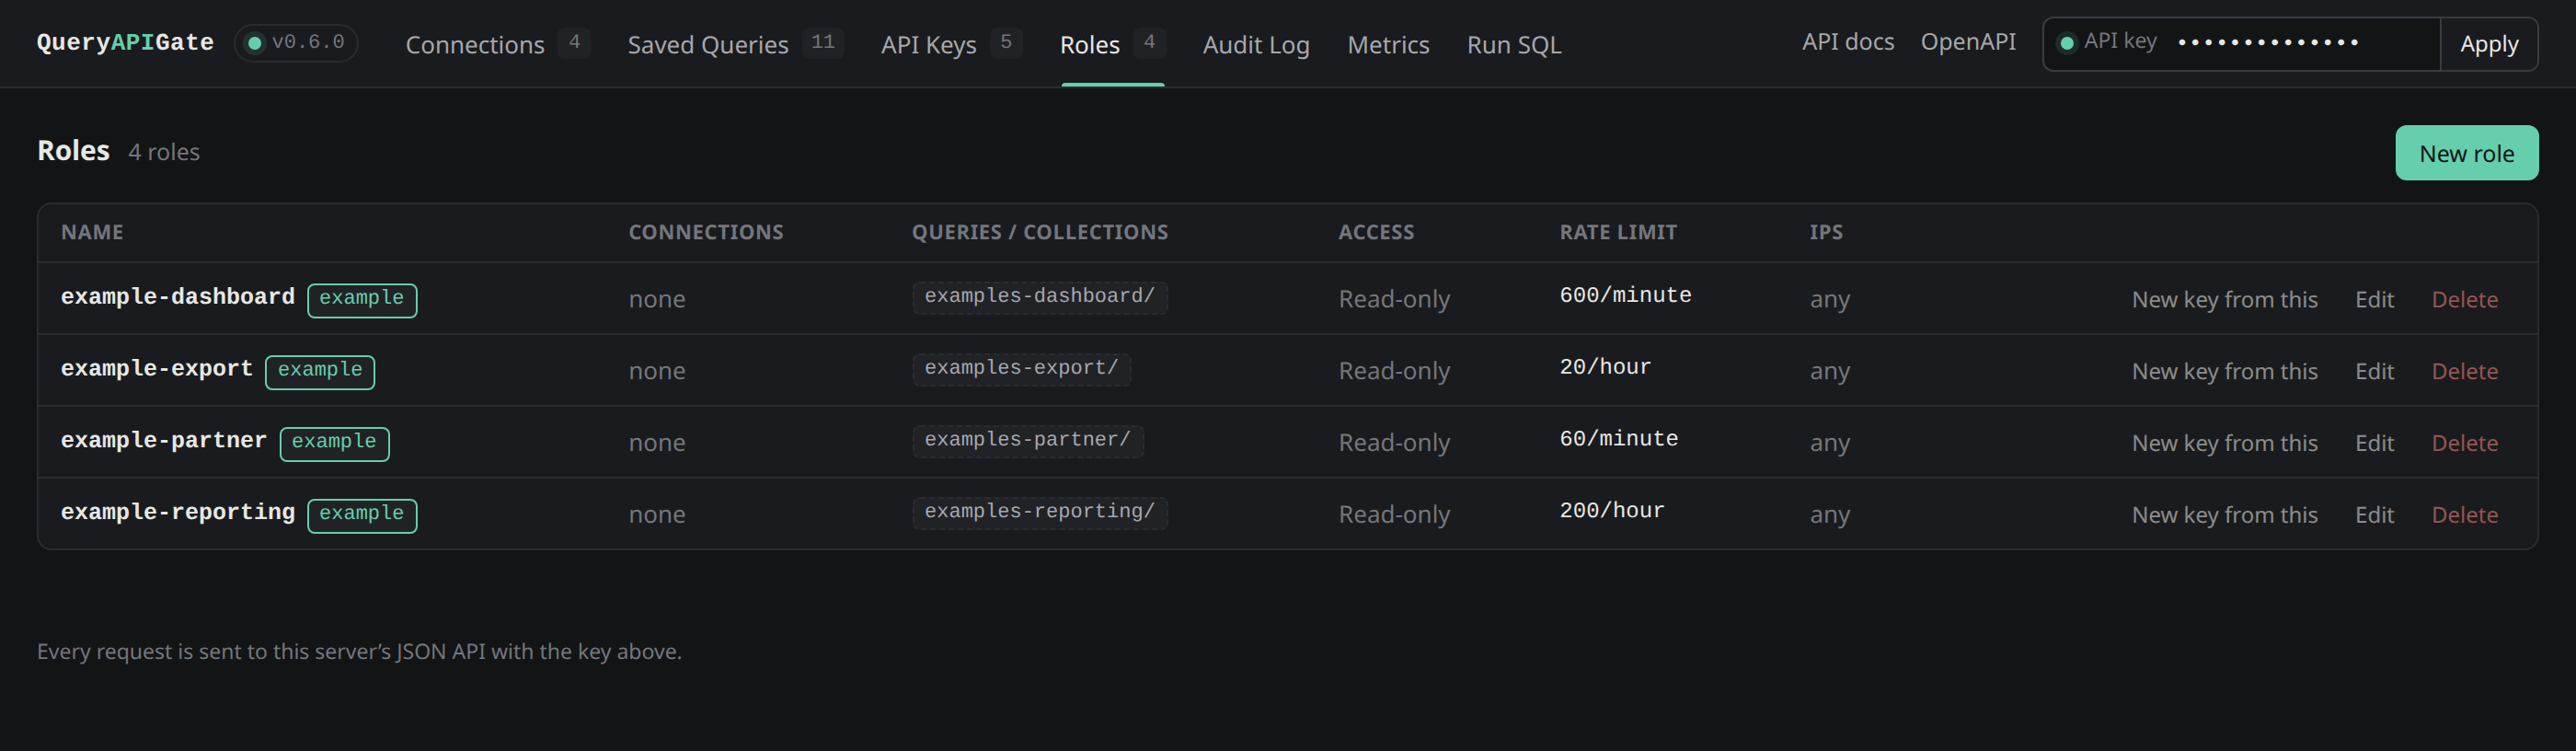
Named roles: a reusable grant template, copied onto a key once at creation |
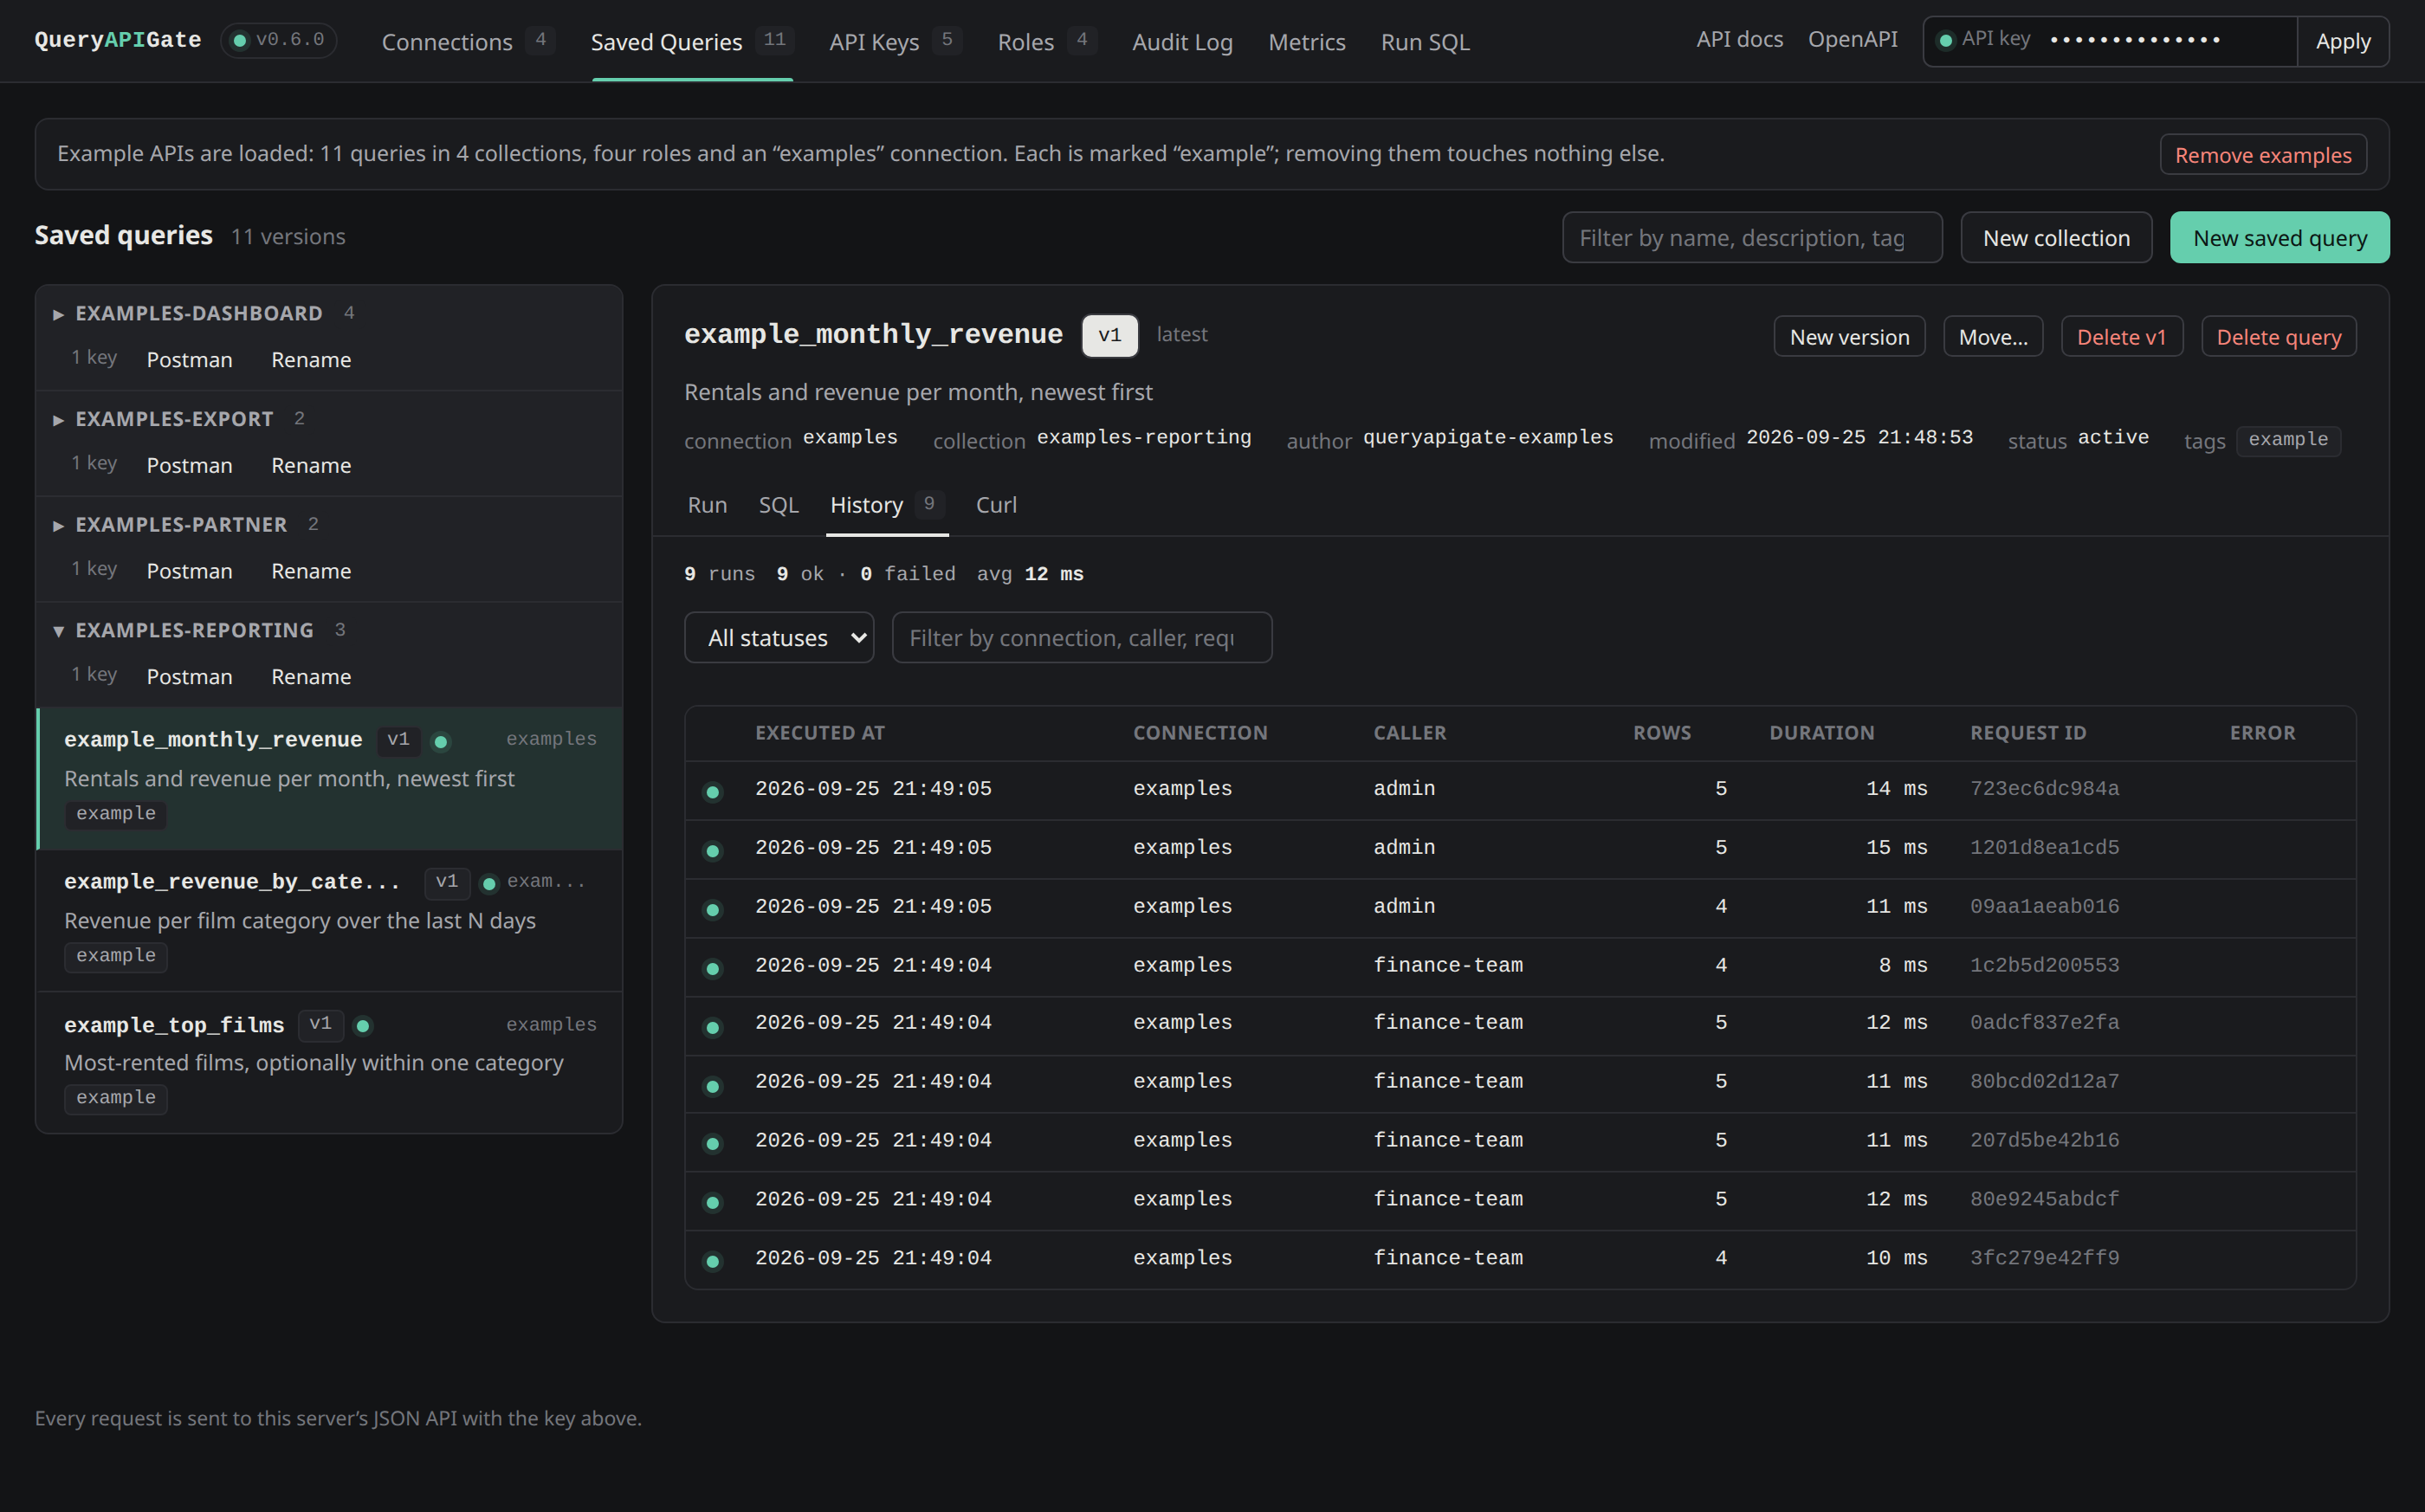
Run history per saved query: who called it, how long it took, and the request ID to find it in the logs |
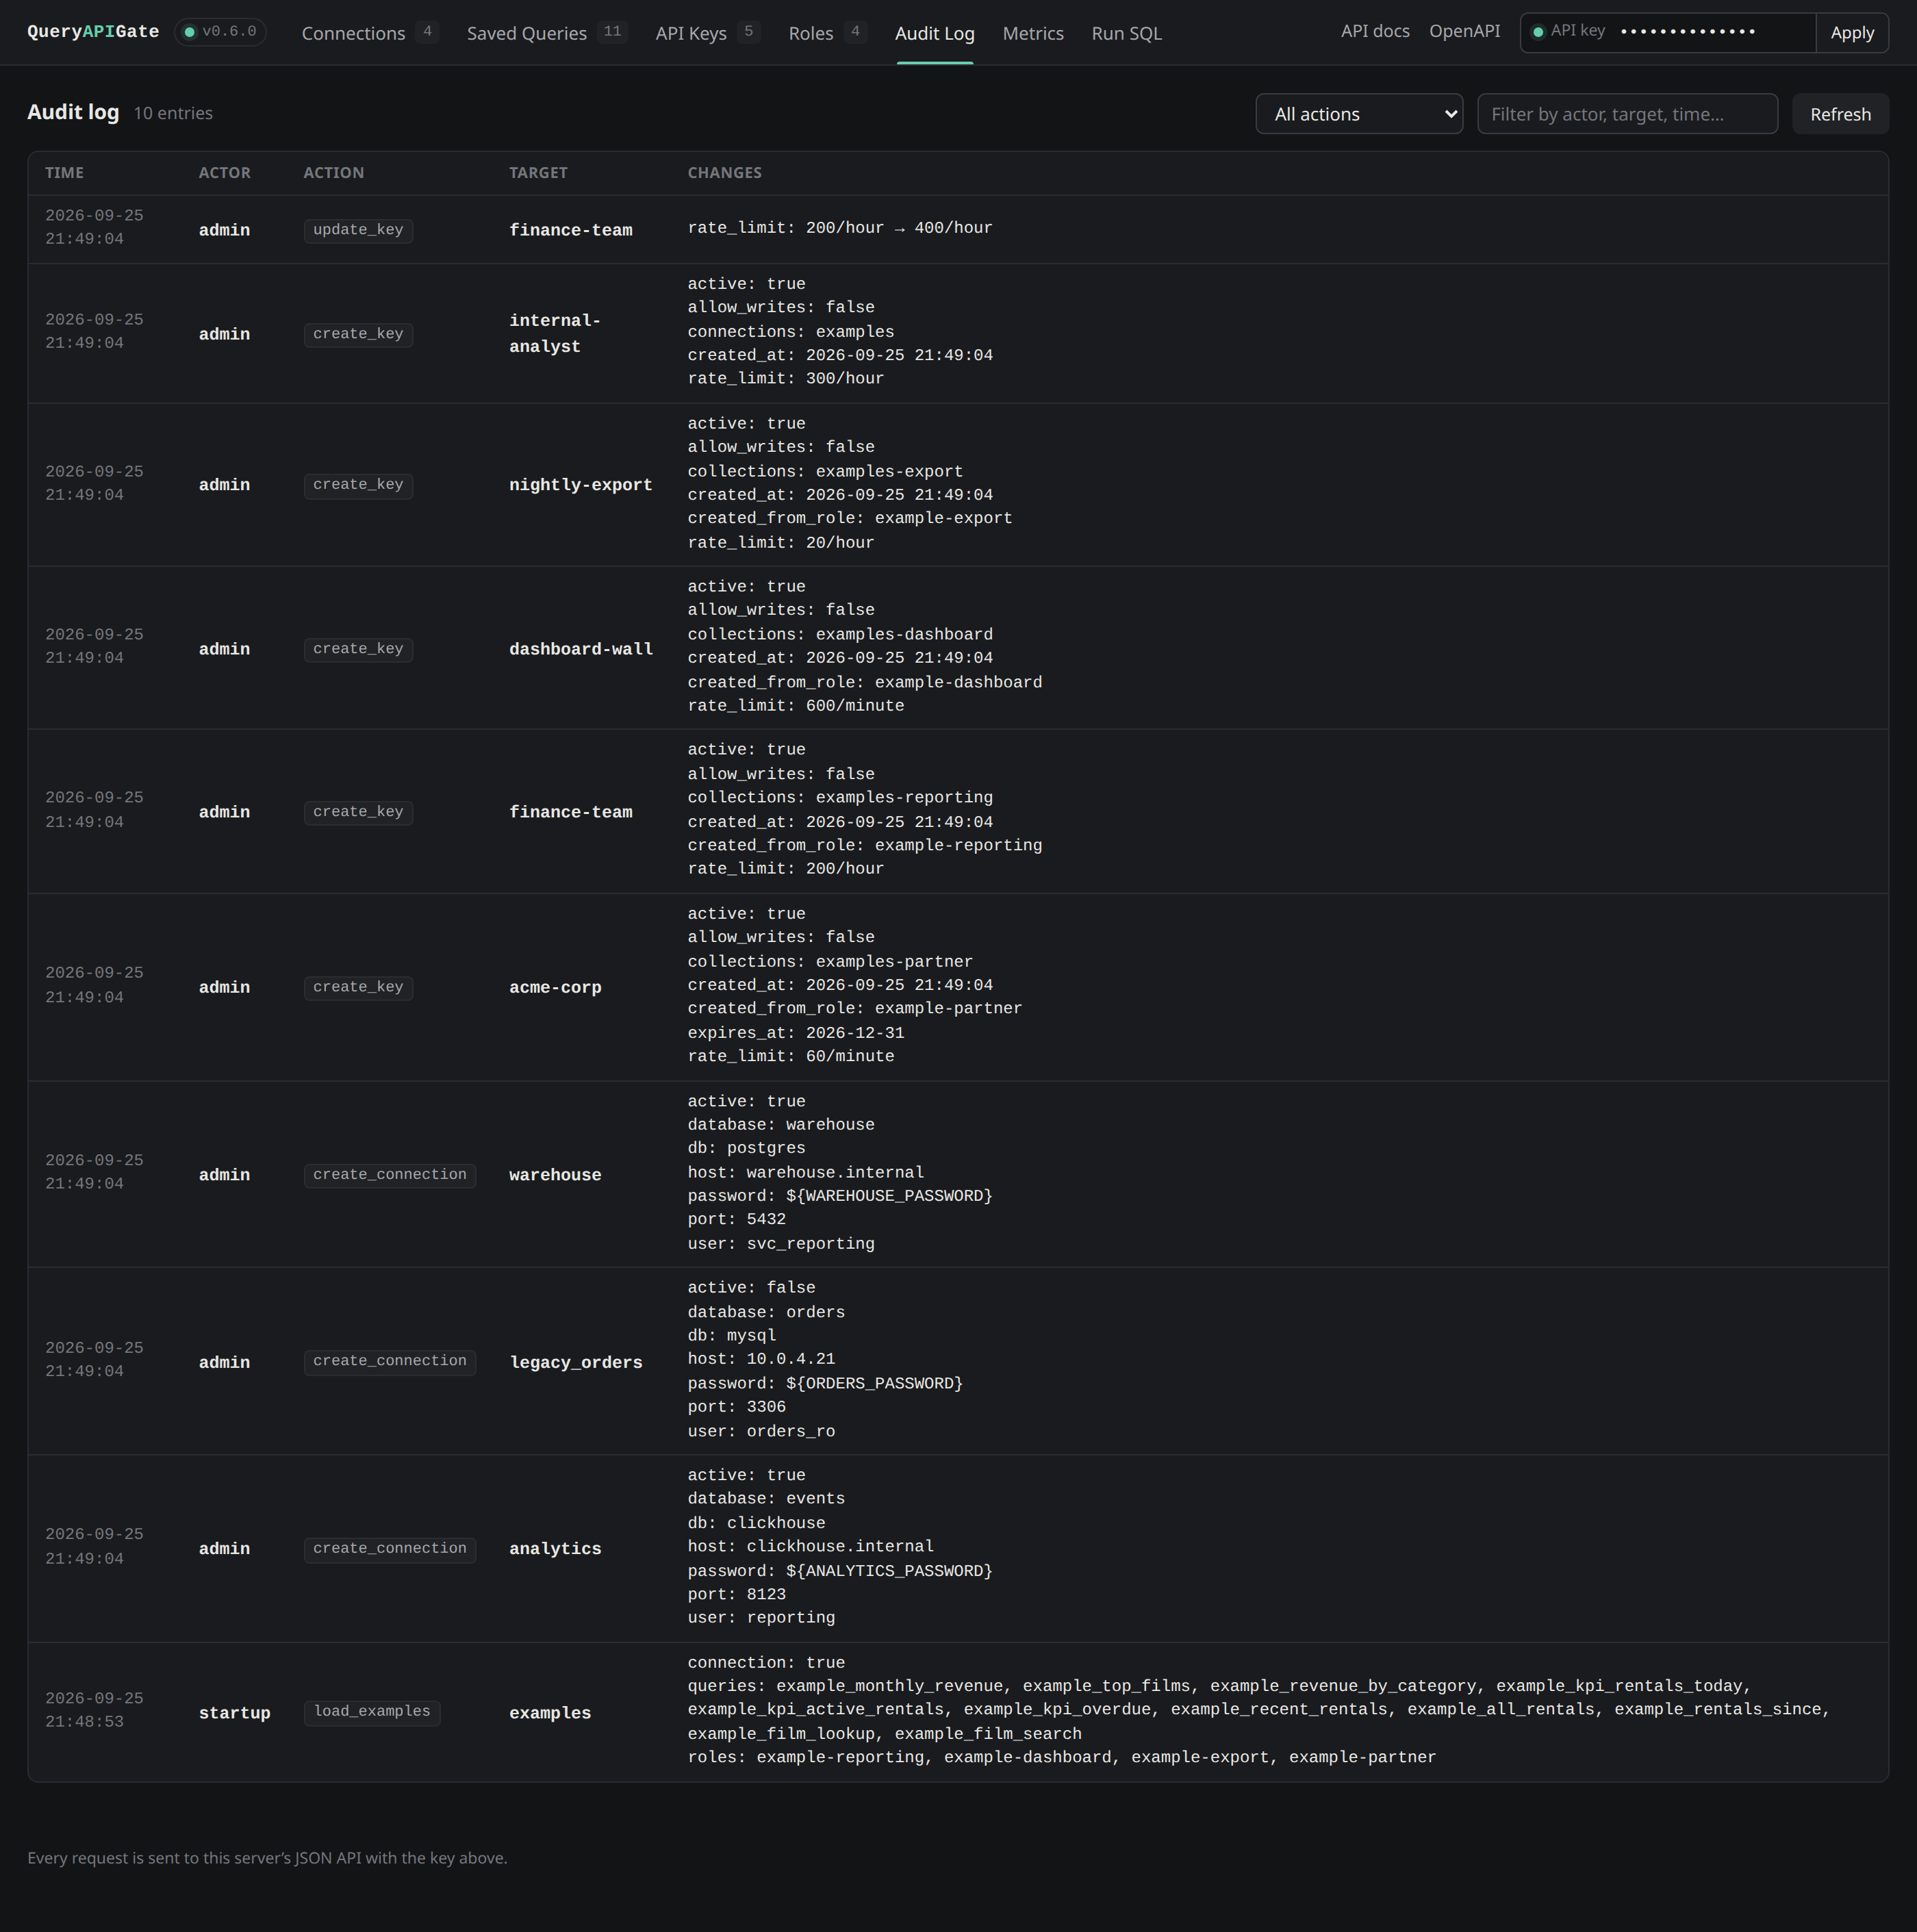
A durable audit log of every configuration change, filterable by action, actor and target |
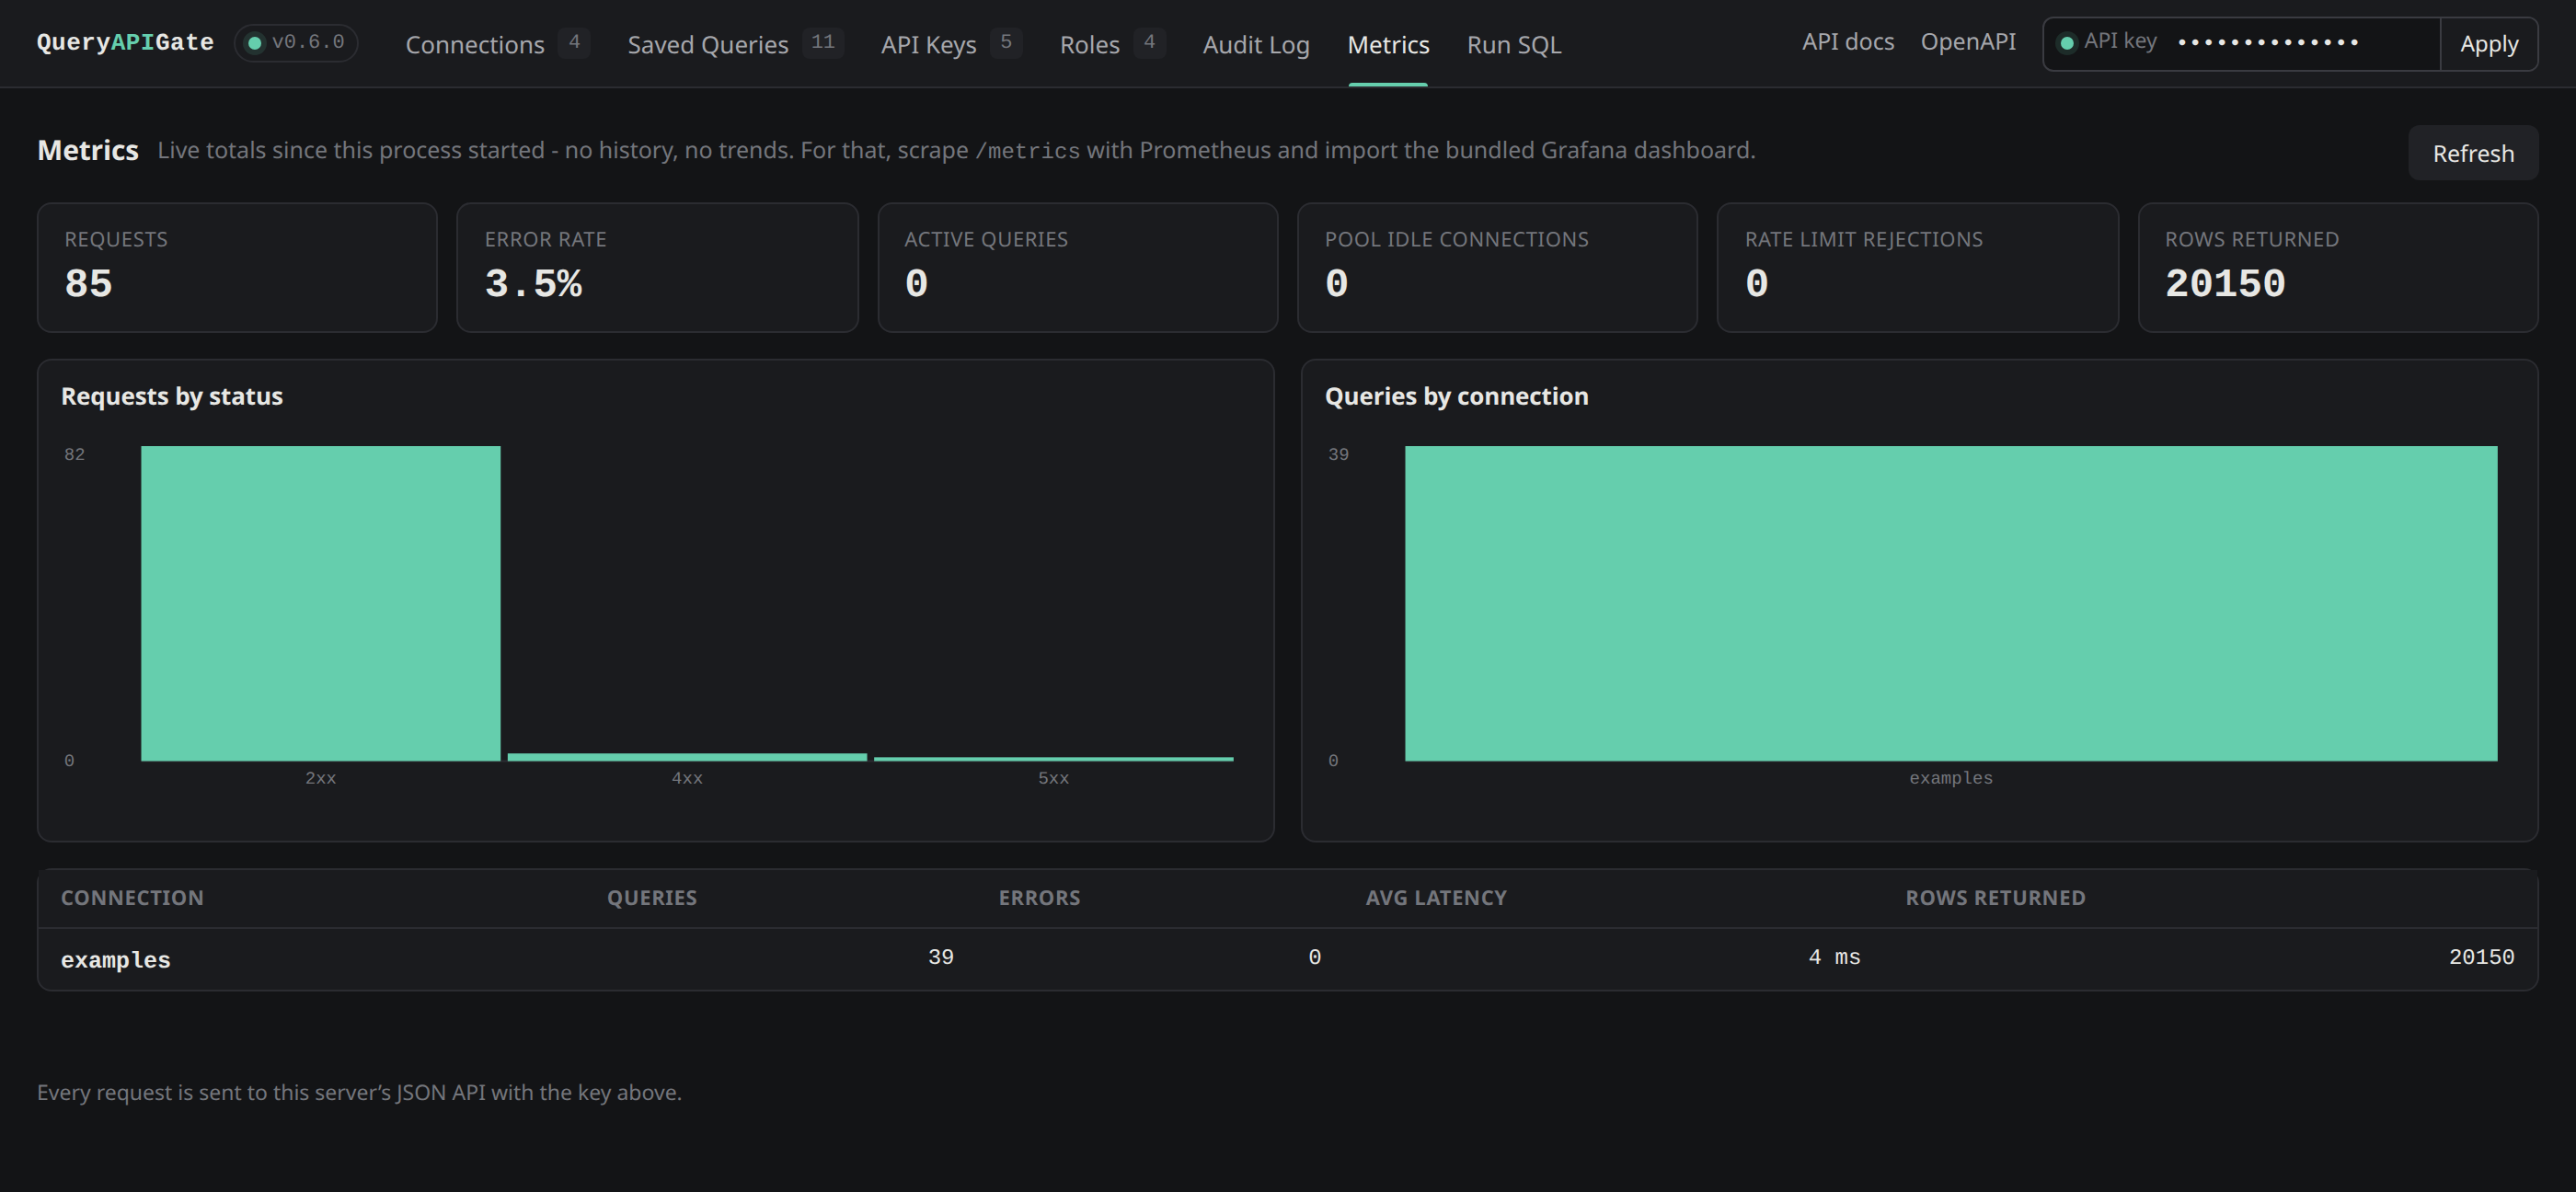
Live metrics with no Prometheus required - or import the bundled Grafana dashboard for history |
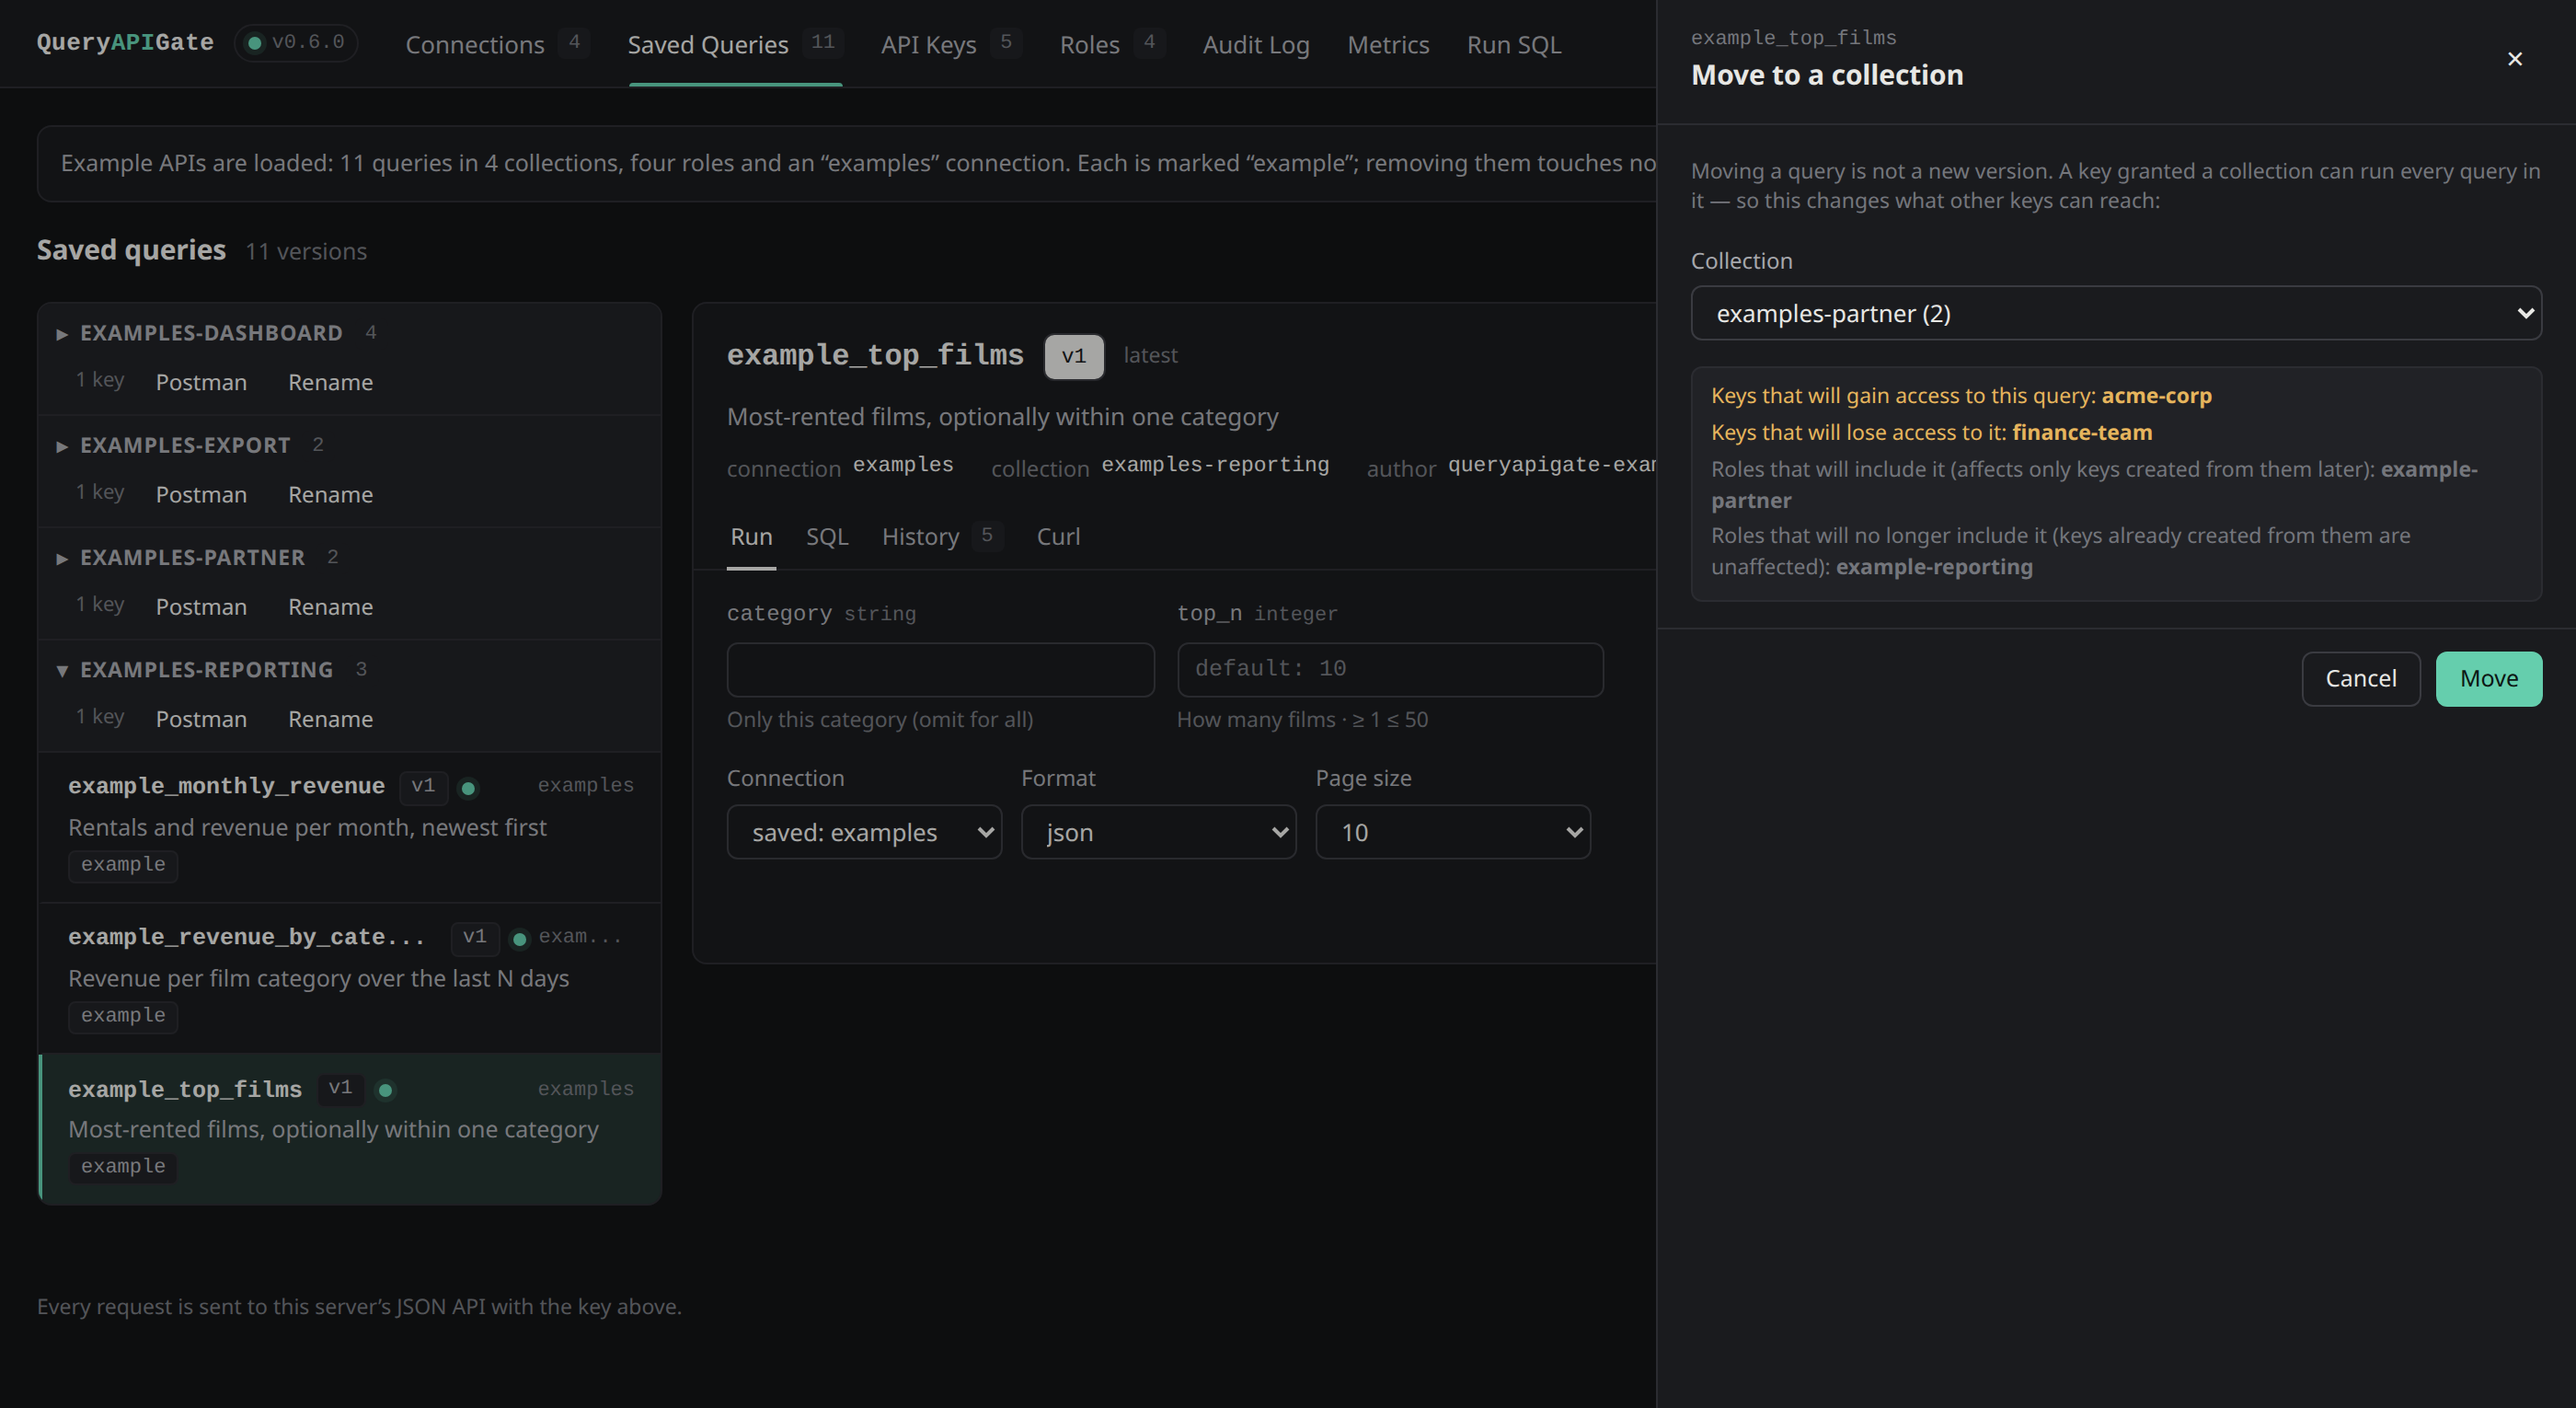
Collections: grant a key a whole group of queries - and see exactly which keys gain or lose access before a query moves |
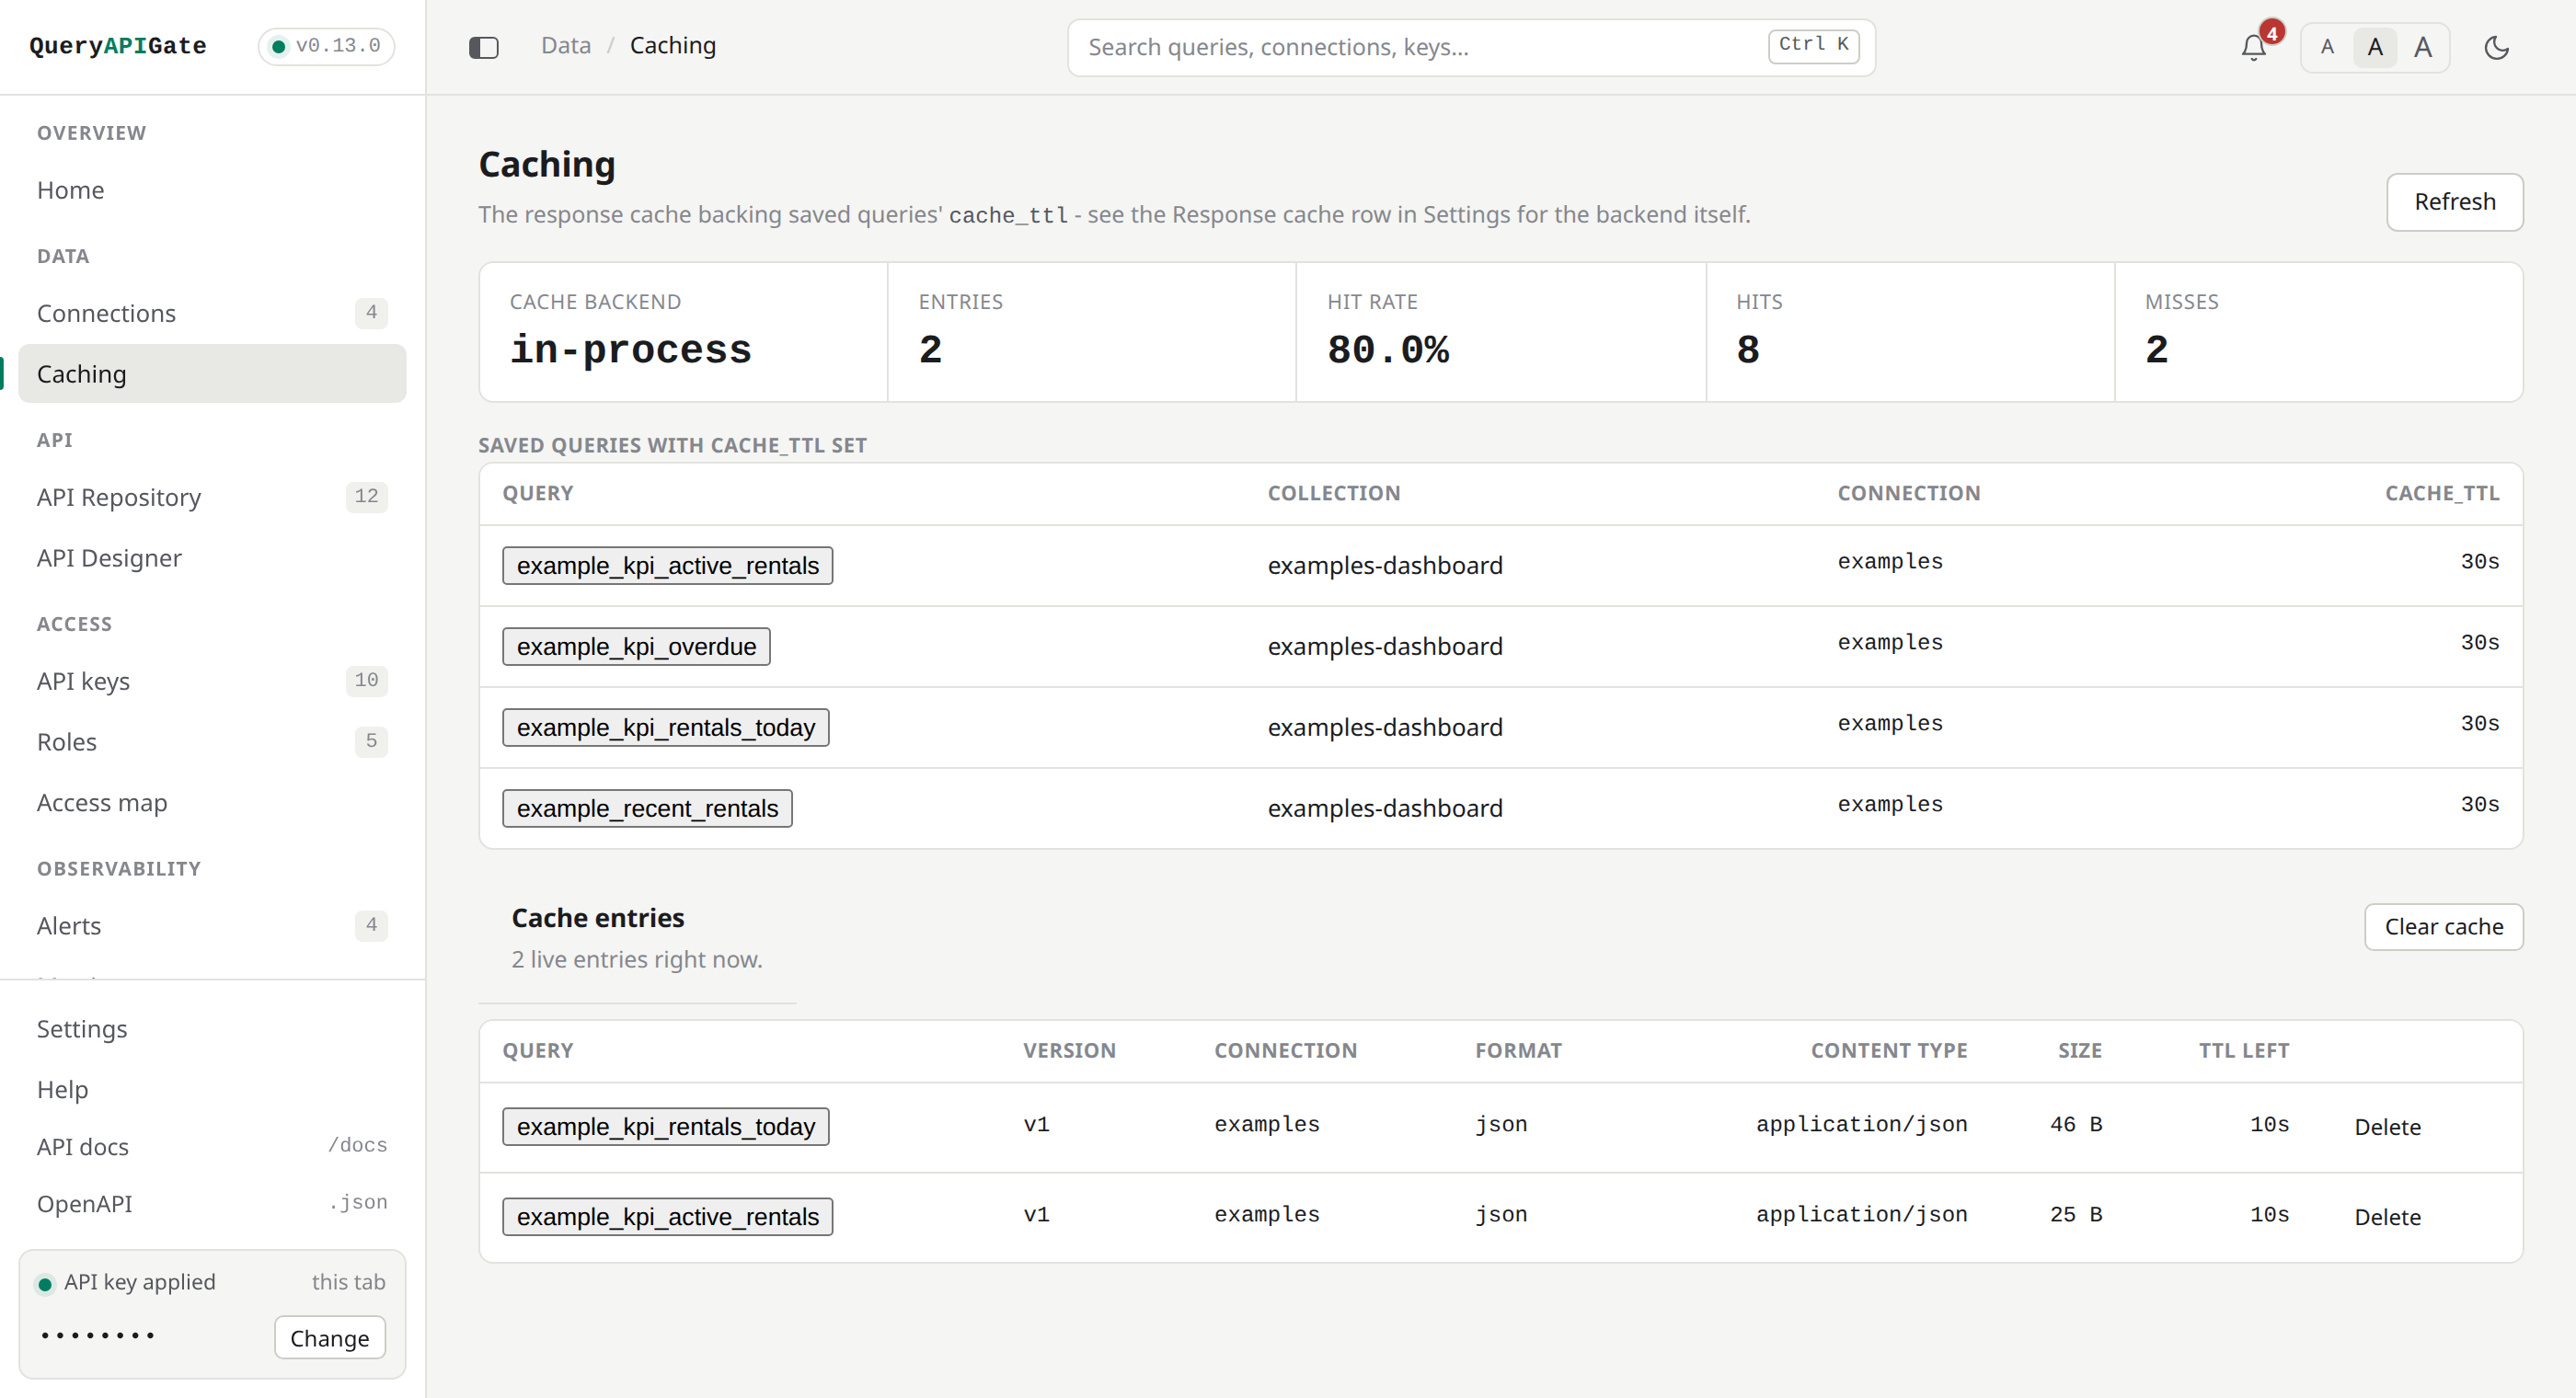
Caching: live hit rate for the response cache backing every saved query's cache_ttl
|
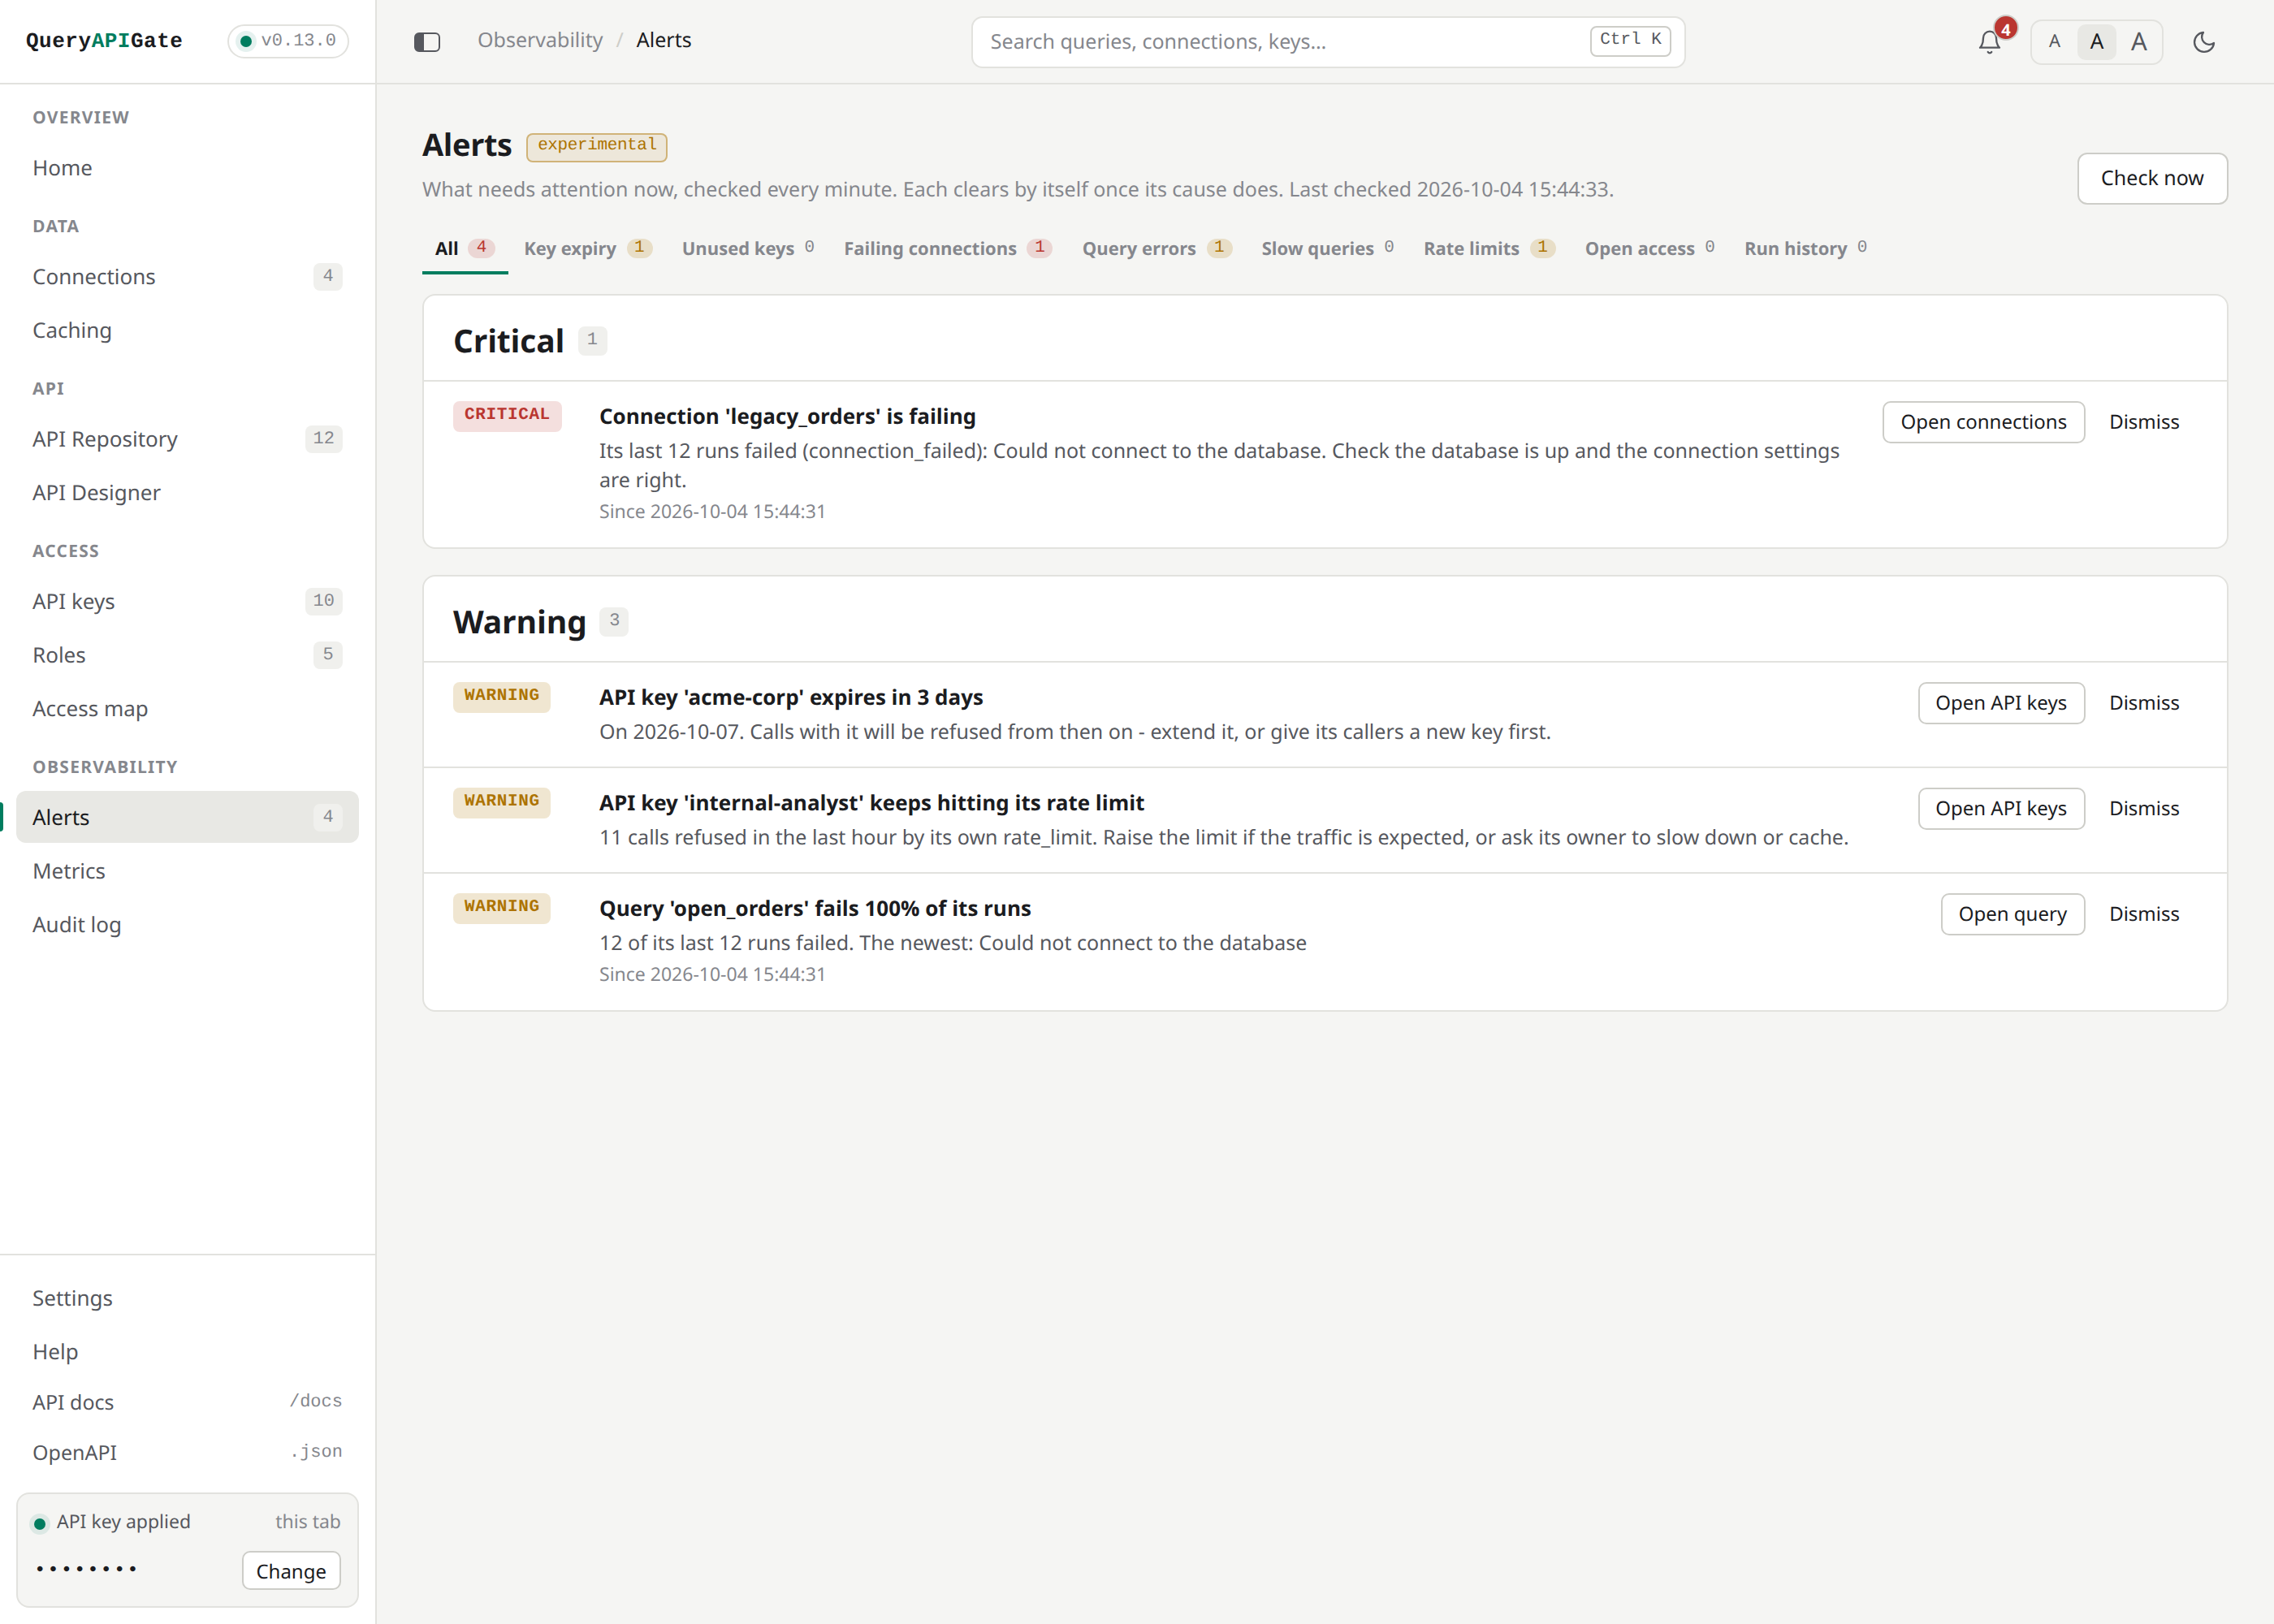
Alerts: failing connections, expiring keys, failing or slow queries, rate limits being hit - each with what to do, clearing by itself once fixed |
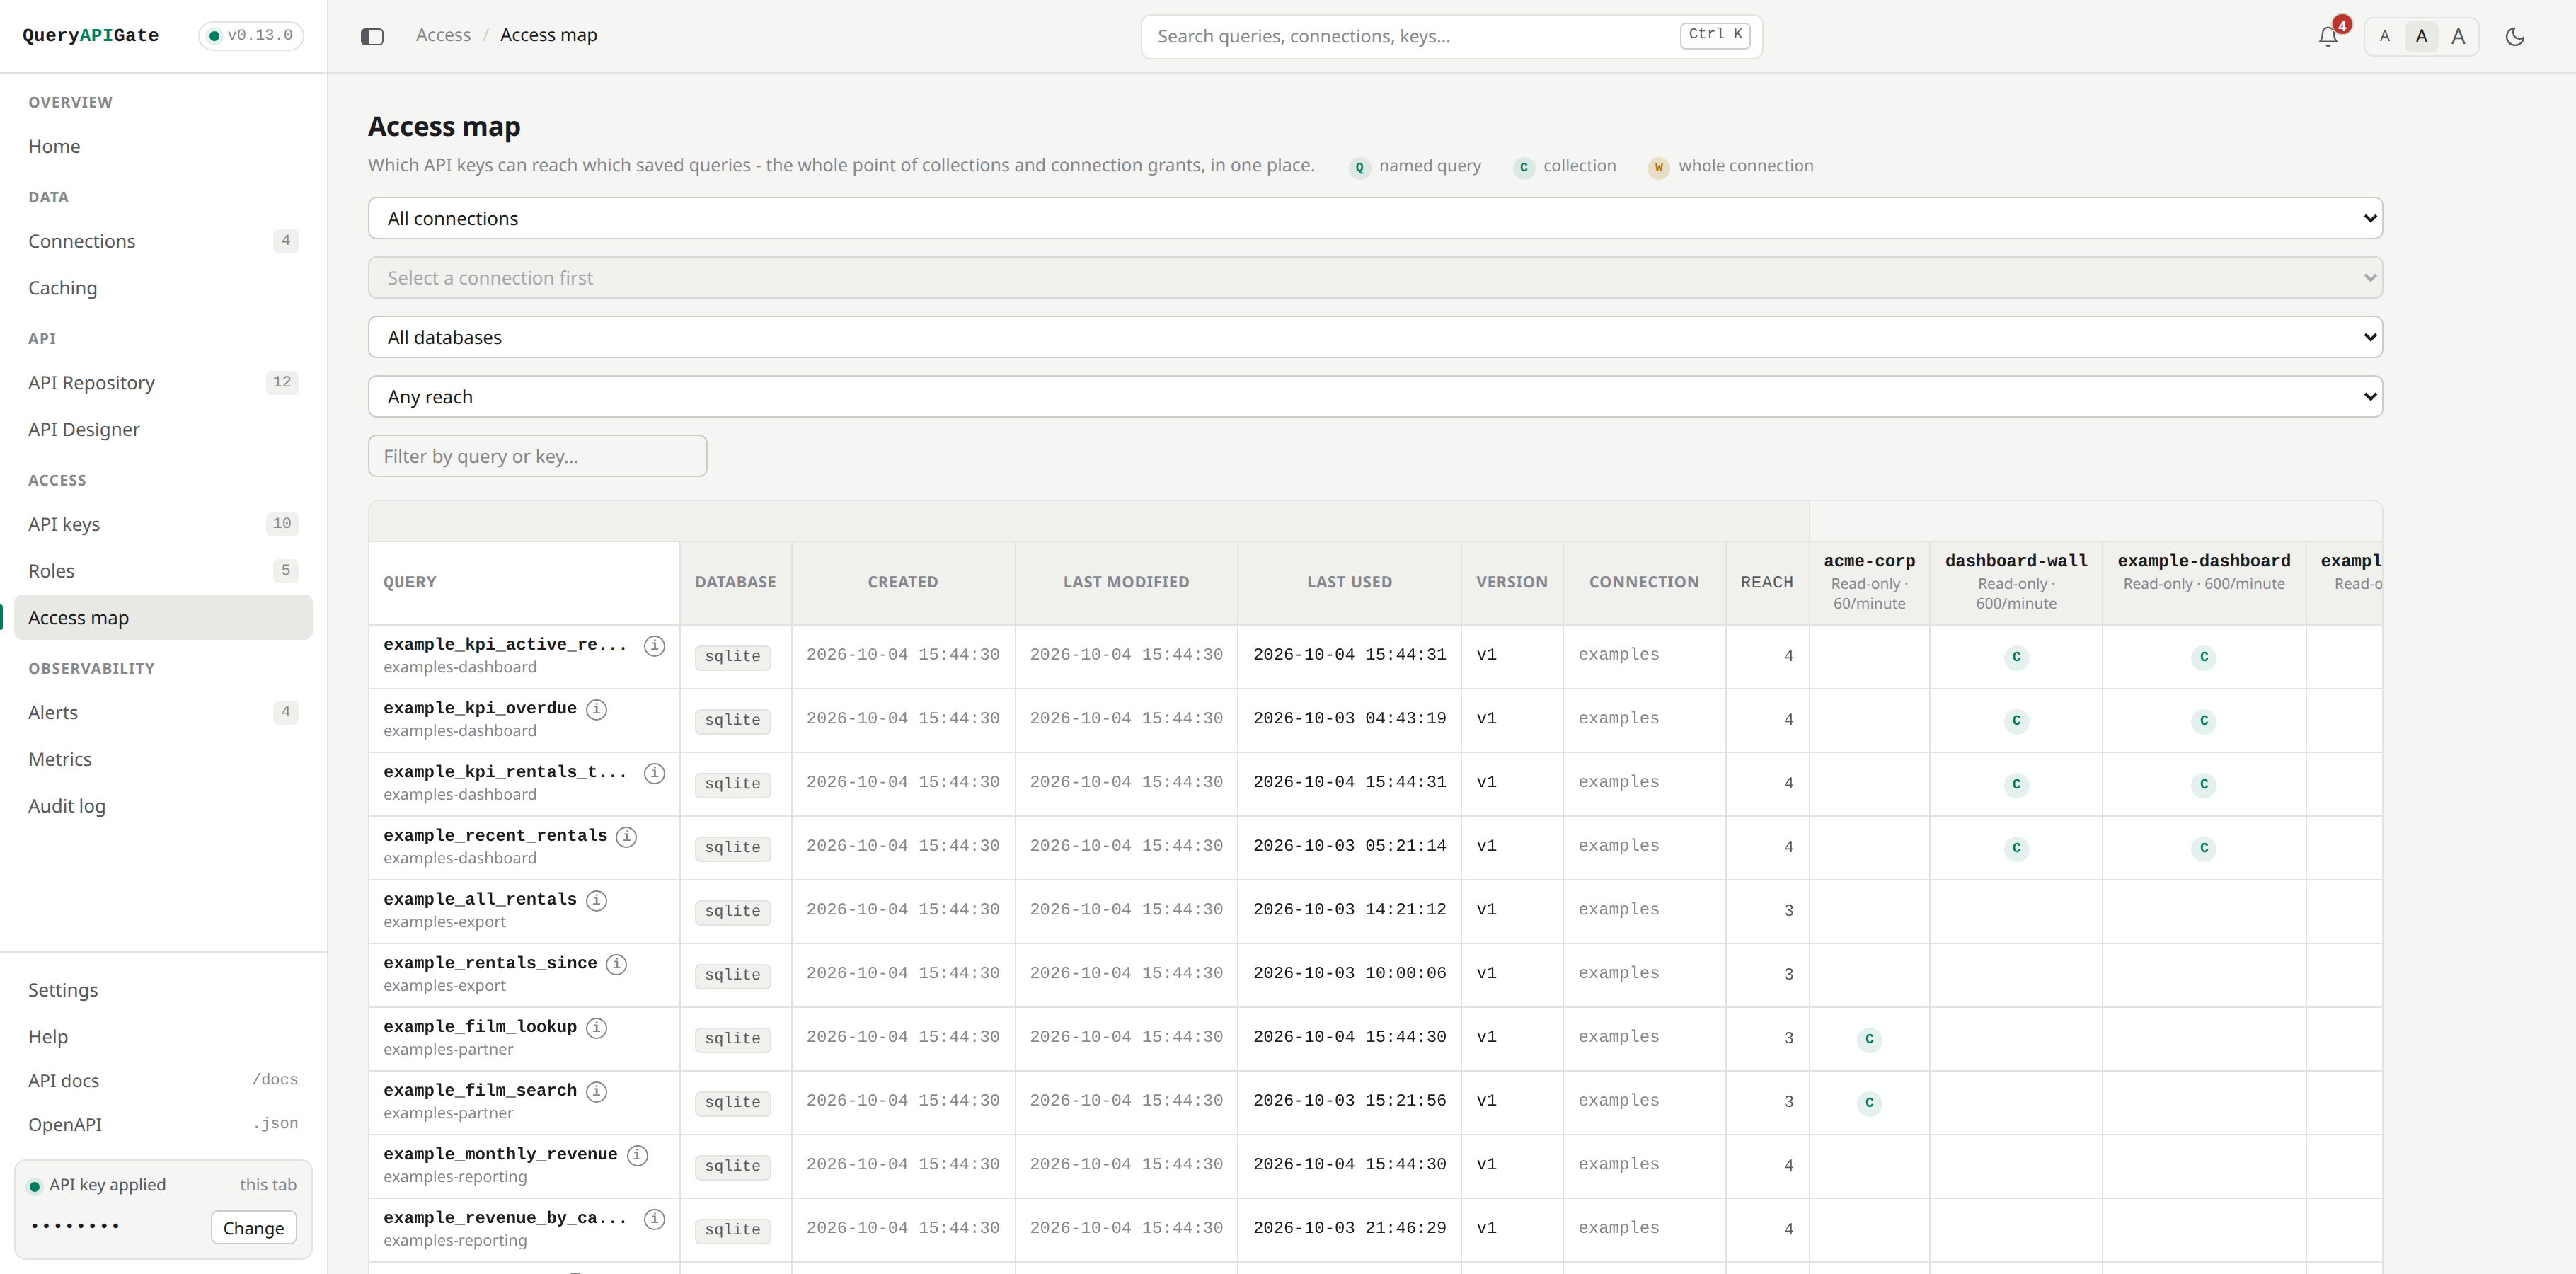
Access map: which key can call which query, and why - one grid instead of reading every grant |
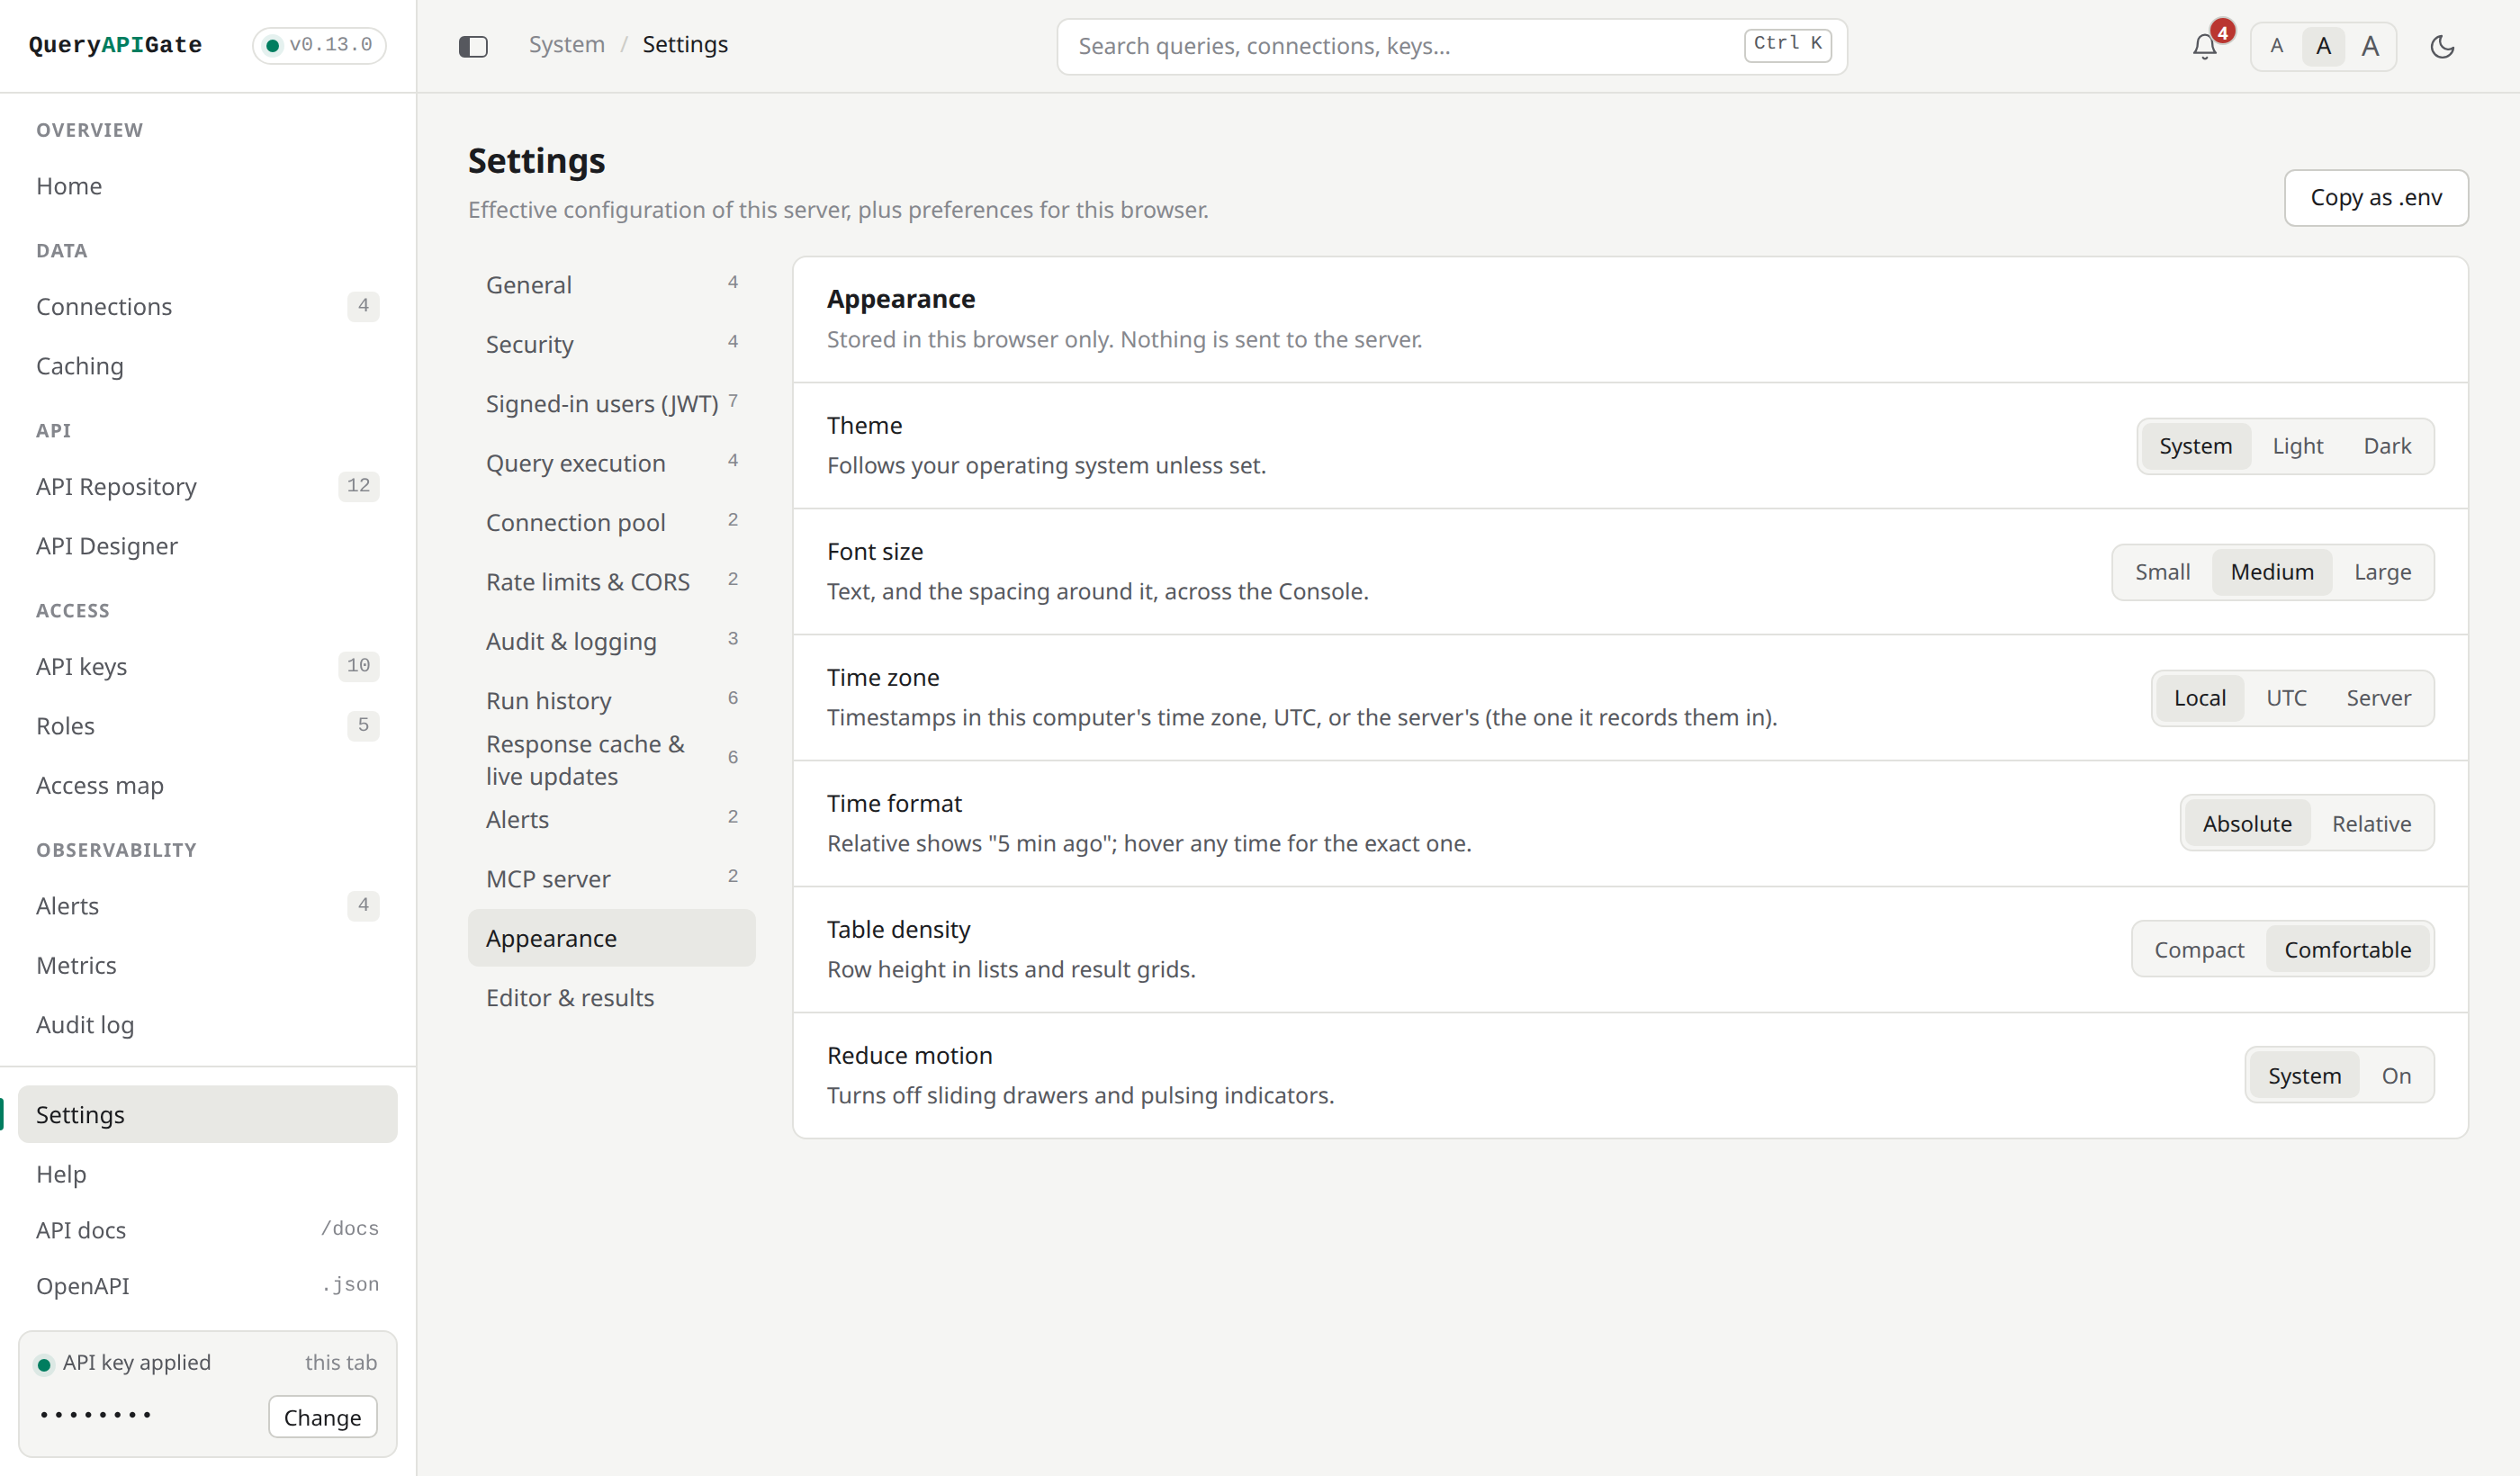
Settings: the server's effective configuration, read-only, plus per-browser appearance and editor preferences |
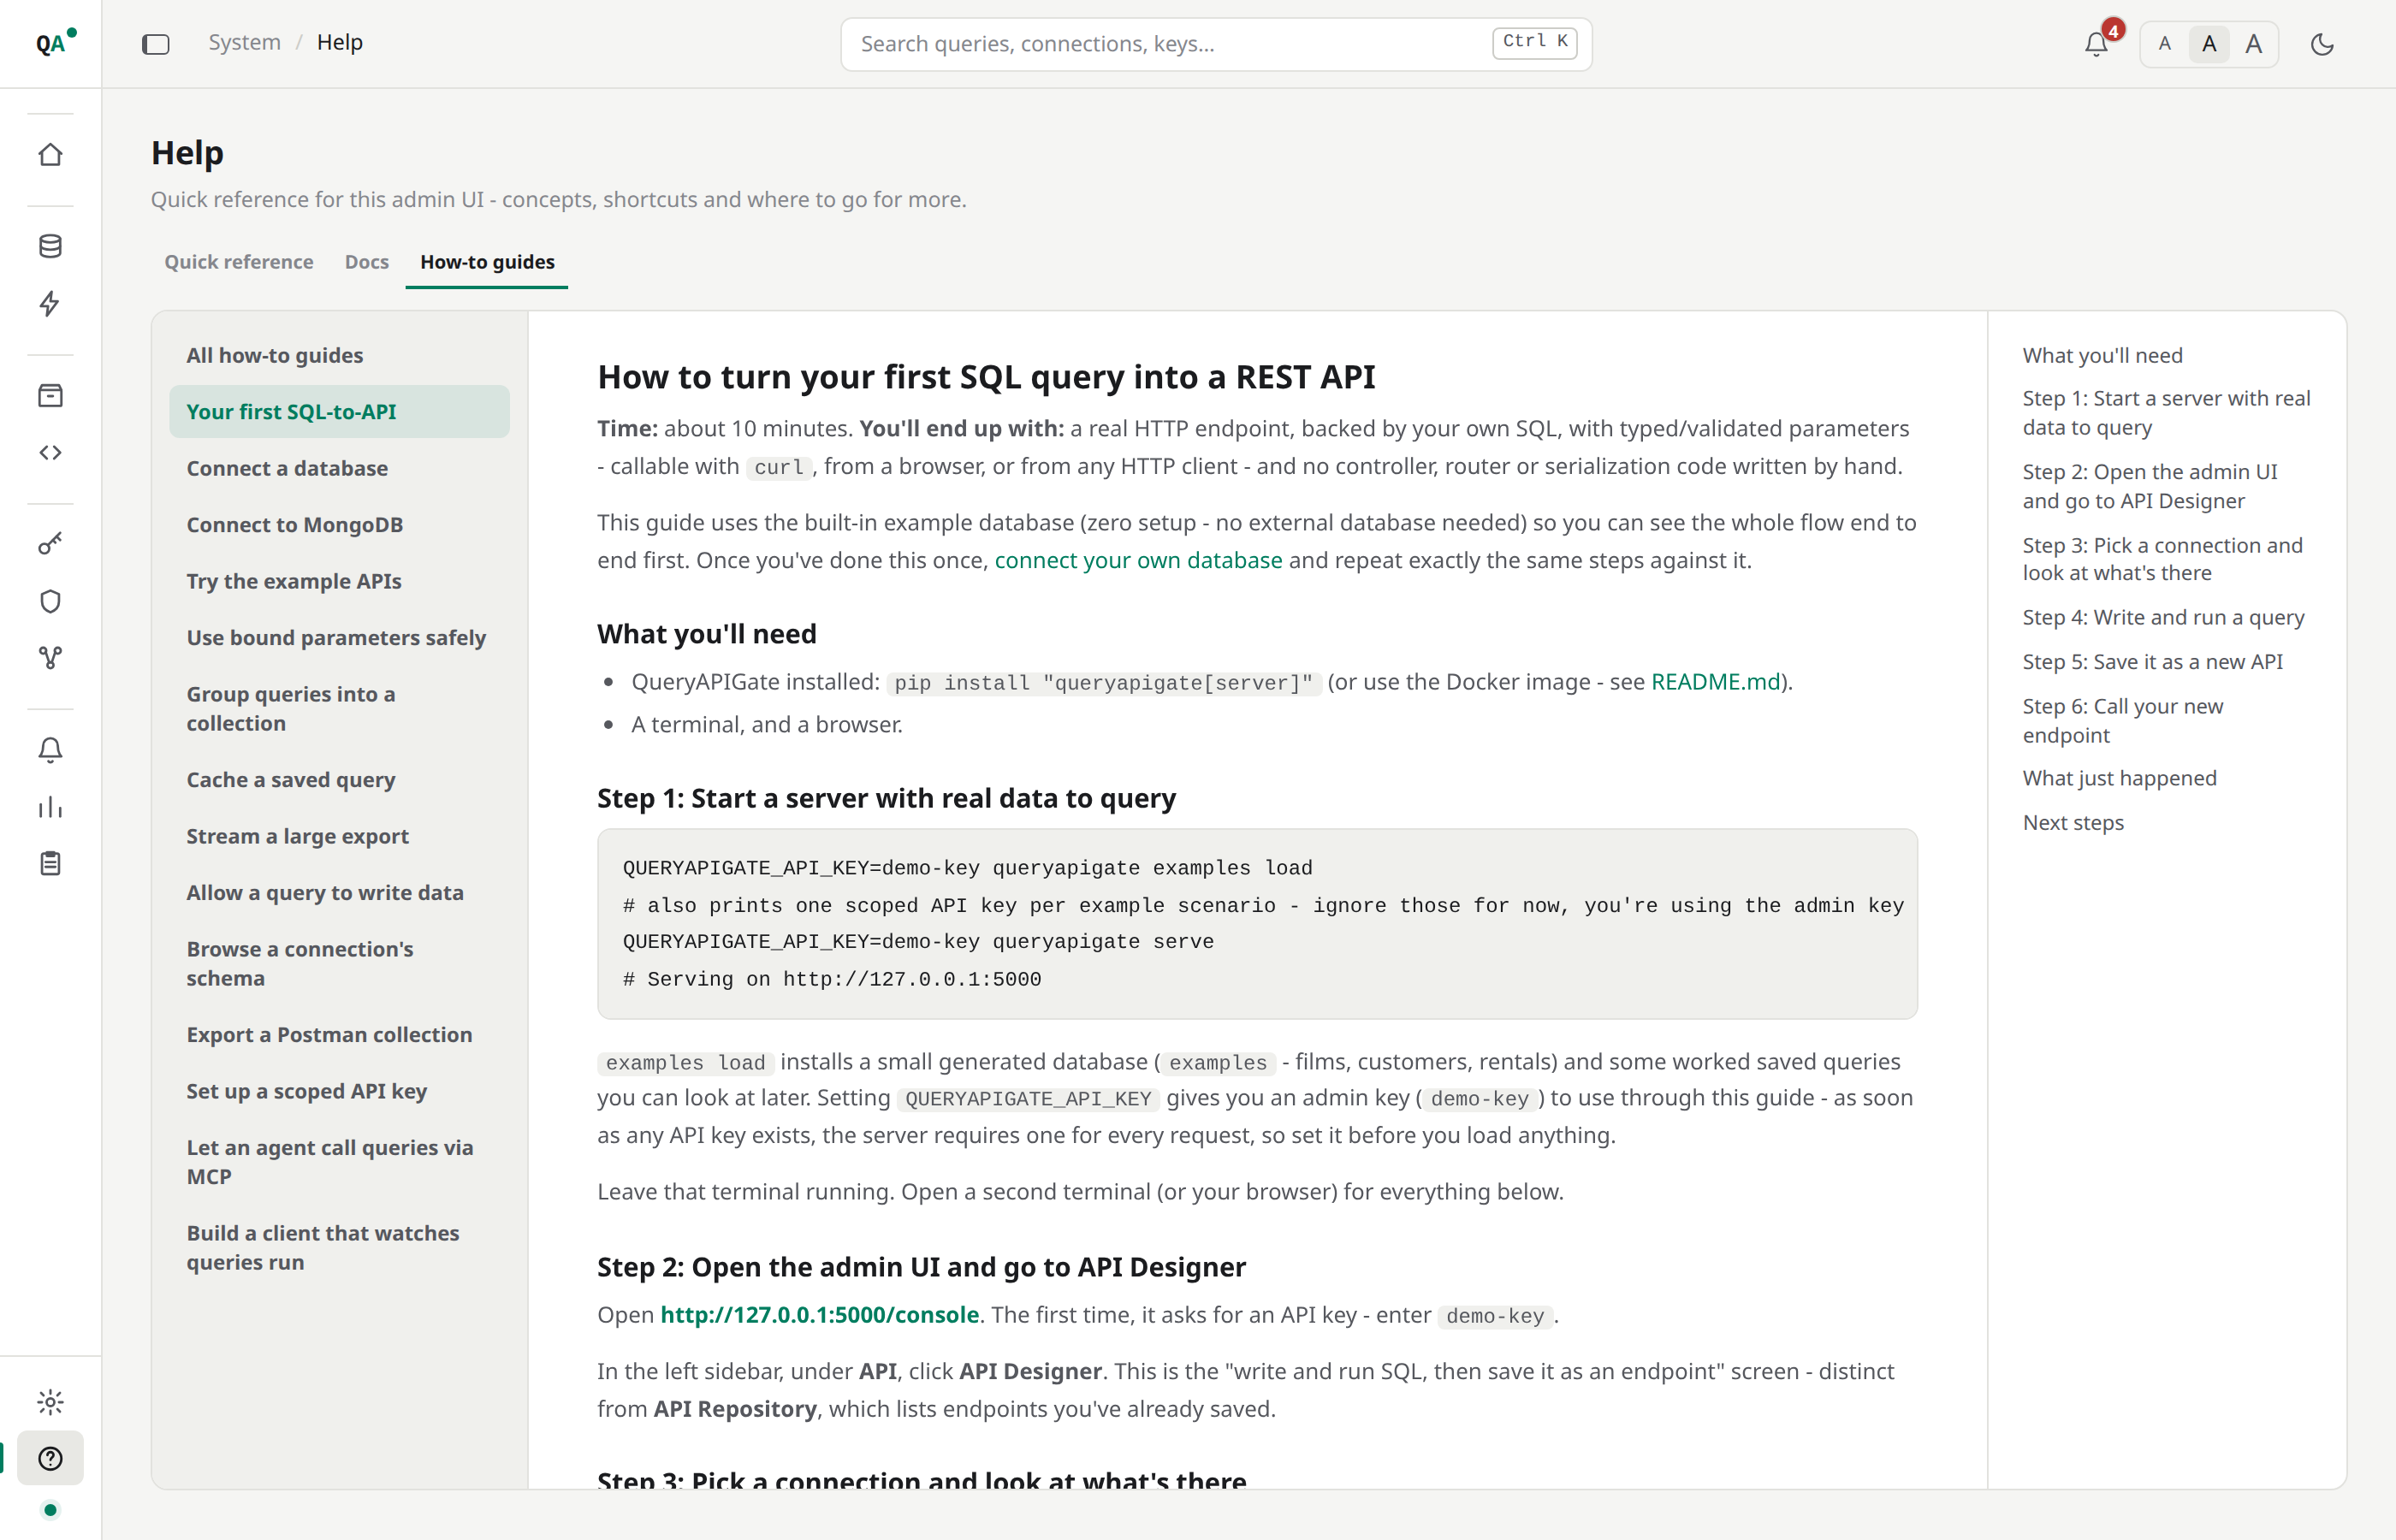
Help: the docs and how-to guides for the version you run, inside the Console |
Light or dark, three font sizes - switched from the top right corner |